
Economy

Producer Price Indexes of Sheet Steel, Aluminum, Plastic and Transportation
Written by Peter Wright
March 19, 2017
Last Tuesday the Bureau of Labor Statistics (BLS) released its series of producer price indexes (PPI), for more than 10,000 goods and materials. For an explanation of this program see the end of this piece. The latest release reported results through February. We run this analysis every three or four months to provide information for subscribers of any changes in the competitive position of steel against other materials and rail vs. truck transportation. The PPI data are helpful in monitoring the price direction of steel and steel products against competing materials and products.
![]() As far as we at SMU can tell from comparison with known transaction prices, these PPI are a reasonable representation of the real world though there may be a lag between the BLS reports and spot prices for steel products. We have also concluded that the actual index values of the PPIs of different products cannot be compared with one another because they are developed by different committees within the BLS. We believe that this data is useful in comparing the direction of prices in the short and medium term but not the absolute value.
As far as we at SMU can tell from comparison with known transaction prices, these PPI are a reasonable representation of the real world though there may be a lag between the BLS reports and spot prices for steel products. We have also concluded that the actual index values of the PPIs of different products cannot be compared with one another because they are developed by different committees within the BLS. We believe that this data is useful in comparing the direction of prices in the short and medium term but not the absolute value.
The following is an abridged version of the February report from the BLS: “The Producer Price Index for final demand increased 0.3 percent in February, seasonally adjusted. Final demand prices rose 0.6 percent in January and 0.2 percent in December. On an unadjusted basis, the final demand index climbed 2.2 percent for the 12 months ended February 2017, the largest advance since a 2.4-percent increase in the 12 months ended March 2012. Prices for final demand goods moved up 0.3 percent in February, the sixth consecutive rise. Over half of the broad-based February increase can be traced to the index for final demand energy, which advanced 0.6 percent. The index for processed goods for intermediate demand moved up 0.4 percent in February, the sixth consecutive increase. About 80 percent of the February rise is attributable to a 0.5-percent advance in prices for processed materials less foods and energy. A major factor in the February advance in the index for processed goods for intermediate demand was prices for primary basic organic chemicals, which increased 4.3 percent. The indexes for electric power, cold rolled steel sheet and strip, residual fuels, rubber and rubber products, and lubricating oil base stocks also moved higher. The indexes for gasoline and ethanol decreased.”
For the purpose of this report, we at SMU have extracted comparative statistics for sheet steel, aluminum and plastic products and truck and rail transportation. Table 1 is a summary of each category on a year over one, two and three year basis.
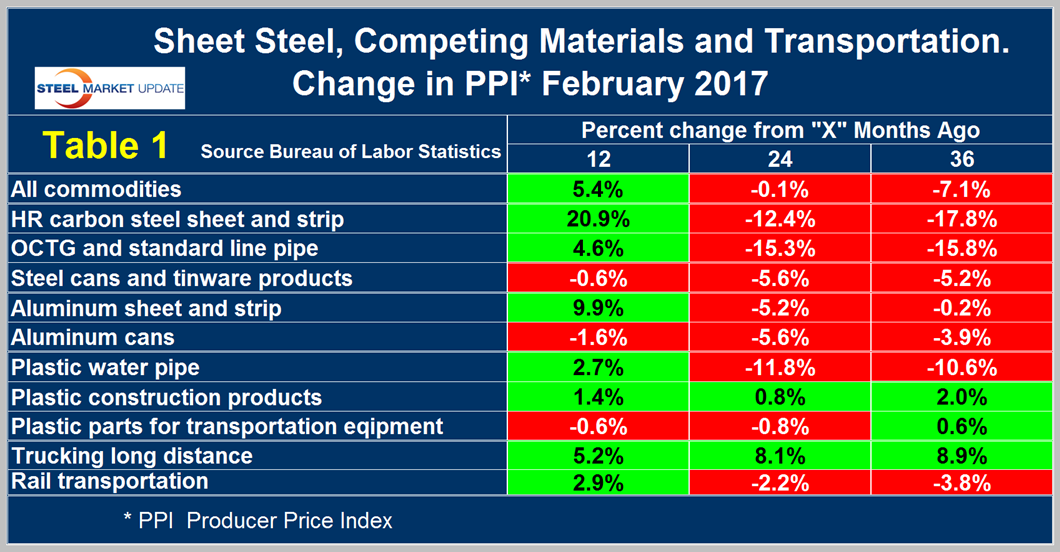
The gain/loss pattern as shown by the color codes in this latest update on a year/1 year basis is much better than in any of our reports since January 2015. Our analysis of the PPI data shows that commodity prices as a whole rose by 5.4 percent in 12 months through February, an improvement from the 7.1 percent decline in 36 months. If as expected the US dollar rises during the balance of the year as the Fed raises interest rates, there will be downward pressure on commodity prices. It is evident from Table 1 that carbon steel sheet increased by much more than aluminum sheet at the 12 month level, which was a recovery from the greater declines for steel at the 24 and 36 month levels. The change in the PPI of steel and aluminum cans has been similar over all three time periods. The PPI of OCTG increased in the last twelve months after severe declines in the previous two years. We understand that steel dominates in most oil production and refining applications as plastic is used more often in distribution, mostly of natural gas, to end users. The PPI of plastic piping improved in the last year after declining by less than OCTG in the previous two years. An analyst of Cleveland based Freedom Group Inc., told AMM that plastic made significant inroads in oil and gas pipe applications in 2009 through 2012 but since then inroads have slowed.
Table 1 also shows price changes for truck and rail transportation and indicates that rail has become more competitive in all three time periods considered.
The official description from the BLS reads as follows: The Producer Price Index (PPI) is a family of indexes that measure the average change over time in the prices received by domestic producers of goods and services. PPIs measure price change from the perspective of the seller. This contrasts with other measures, such as the Consumer Price Index (CPI). CPIs measure price change from the purchaser’s perspective. Sellers’ and purchasers’ prices can differ due to government subsidies, sales and excise taxes, and distribution costs. More than 10,000 PPIs for individual products and groups of products are released each month. PPIs are available for the products of virtually every industry in the mining and manufacturing sectors of the U.S. economy. New PPIs are gradually being introduced for the products of industries in the construction, trade, finance, and services sectors of the economy. More than 100,000 price quotations per month are organized into three sets of PPIs: (1) Stage-of-processing indexes (2) commodity indexes, and (3) indexes for the net output of industries and their products. The stage-of processing structure organizes products by class of buyer and degree of fabrication. The commodity structure organizes products by similarity of end use or material composition. The entire output of various industries is sampled to derive price indexes for the net output of industries and their products.

Peter Wright
Read more from Peter WrightLatest in Economy

Fed Beige Book: Economy improves, but manufacturing weak
While general economic conditions across the US improved slightly over the last six weeks, activity in the manufacturing sector was weak, according to the Fed’s latest Beige Book report.

SMU Community Chat: Simonson with the latest on construction
A lot of economists were predicting a recession last year. Ken Simonson, chief economist for The Associated General Contractors of America (AGC), wasn’t one of them.

Housing starts slip to seven-month low in March
Following a strong February, US housing starts eased through March to a seven-month low, according to the most recent data from the US Census Bureau.
Manufacturing activity in New York state continues to soften
New York state saw a continued decline in manufacturing activity in April, according to the latest Empire State Manufacturing Survey from the Federal Reserve Bank of New York
Worldsteel projects steel demand to grow 1.7% this year
Global steel demand will reach roughly 1.793 million metric tons (1.976 million short tons) this year, an increase of 1.7% over 2023, the World Steel Association (worldsteel) said in its updated Short Range Outlook report. The gain will come after a 0.5% contraction in steel demand in 2023. Demand is forecasted to increase another 1.2% […]