
Economy

Architecture Billings Index Soars to 54.3
Written by Brett Linton
April 19, 2017
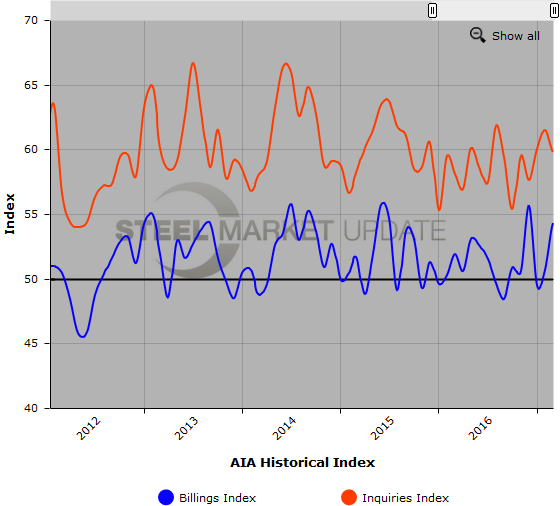
Washington, D.C. – April 19, 2017 – The first quarter of the year ended on a positive note for the Architecture Billings Index (ABI). As a leading economic indicator of construction activity, the ABI reflects the approximate nine to twelve month lead time between architecture billings and construction spending. The American Institute of Architects (AIA) reported the March ABI score was 54.3, up from a score of 50.7 in the previous month. This score reflects a sizable increase in design services (any score above 50 indicates an increase in billings). The new projects inquiry index was 59.8, down from a reading of 61.5 the previous month, while the new design contracts index dipped from 54.7 to 52.3.
“The first quarter started out on uneasy footing, but fortunately ended on an upswing entering the traditionally busy spring season,” said AIA Chief Economist, Kermit Baker, Hon. AIA, PhD. “All sectors showed growth except for the commercial/industrial market, which, for the first time in over a year displayed a decrease in design services.”
Key March ABI Highlights:
• Regional averages: Midwest (54.6), South (52.6), Northeast (52.4), West (50.2)
• Sector index breakdown: multi-family residential (54.6), mixed practice (53.7), institutional (52.9),
commercial / industrial (49.8)
• Project inquiries index: 59.8
• Design contracts index: 52.3
About the AIA Architecture Billings Index
The Architecture Billings Index (ABI), produced by the AIA Economics & Market Research Group, is a leading economic indicator that provides an approximately nine to twelve month glimpse into the future of nonresidential construction spending activity. The diffusion indexes contained in the full report are derived from a monthly “Work-on-the-Boards” survey that is sent to a panel of AIA member-owned firms. Participants are asked whether their billings increased, decreased, or stayed the same in the month that just ended as compared to the prior month, and the results are then compiled into the ABI. These monthly results are also seasonally adjusted to allow for comparison to prior months. The monthly ABI index scores are centered around 50, with scores above 50 indicating an aggregate increase in billings, and scores below 50 indicating a decline. The regional and sector data are formulated using a three-month moving average. More information on the ABI and the analysis of its relationship to construction activity can be found in the recently released White Paper, Designing the Construction Future: Reviewing the Performance and Extending the Applications of the AIA’s Architecture Billings Index on the AIA web site.
Below is a graph showing the history of the AIA Billings Index and Inquiries Index. You will need to view the graph on our website to use its interactive features, you can do so by clicking here. If you need assistance logging into or navigating the website, please contact our office at 800-432-3475 or info@SteelMarketUpdate.com.

Brett Linton
Read more from Brett LintonLatest in Economy

Fed Beige Book: Economy improves, but manufacturing weak
While general economic conditions across the US improved slightly over the last six weeks, activity in the manufacturing sector was weak, according to the Fed’s latest Beige Book report.

SMU Community Chat: Simonson with the latest on construction
A lot of economists were predicting a recession last year. Ken Simonson, chief economist for The Associated General Contractors of America (AGC), wasn’t one of them.
Housing starts slip to seven-month low in March
Following a strong February, US housing starts eased through March to a seven-month low, according to the most recent data from the US Census Bureau.
Manufacturing activity in New York state continues to soften
New York state saw a continued decline in manufacturing activity in April, according to the latest Empire State Manufacturing Survey from the Federal Reserve Bank of New York
Worldsteel projects steel demand to grow 1.7% this year
Global steel demand will reach roughly 1.793 million metric tons (1.976 million short tons) this year, an increase of 1.7% over 2023, the World Steel Association (worldsteel) said in its updated Short Range Outlook report. The gain will come after a 0.5% contraction in steel demand in 2023. Demand is forecasted to increase another 1.2% […]