
Environment and Energy

Oil and Gas Prices and Rotary Rig Counts through May 2017
Written by Peter Wright
May 18, 2017
The prices of oil and natural gas drive the consumption of oil country tubular goods (OCTG) and related steel products. The energy markets represent a large portion of the hot rolled coil used to make welded tubular goods as well as equipment used to drill and pump oil and natural gas.
Figure 1 shows historical oil and gas prices since January 2000.
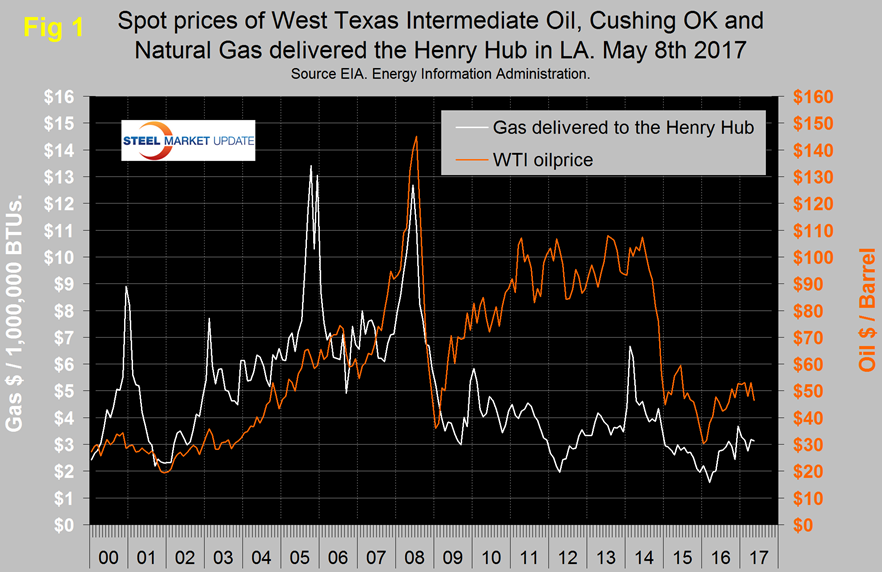
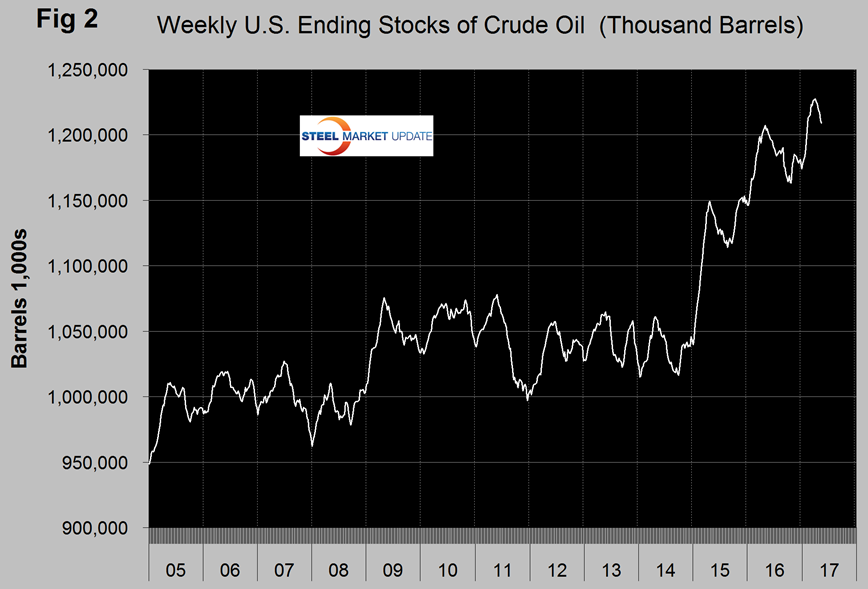
The daily spot price of West Texas Intermediate (WTI) rose through $50 on March 30th and stayed above that level until April 21st after which it fell below $50 and stayed there until the latest price of $46.46 on May 8th. Brent closed at $46.61 on the same day. Data source is the Energy Information Administration (EIA). Weekly U.S. stocks of crude oil, including the strategic reserve have declined for six consecutive weeks through May 12th but are still near the all time high (Figure 2).
EIA’s April 2017 Short-Term Energy Outlook (STEO) expects that electricity generation fueled by natural gas this summer (June, July, and August) will be lower than last summer, but it will continue to exceed that of any other fuel, including coal-fired generation, for the third summer in a row. The projected share of total U.S. generation for natural gas is expected to average 34 percent, which is down from 37 percent last summer but still exceeds coal’s generation share of 32 percent.
OPEC’s next meeting will be on May 25th and extending production curtailment will be at the top of the agenda. On May 13th Garry Bourgeault wrote: Maybe the most disappointing and important factor in the weak response of the price of oil to the production cut deal of OPEC and other producers has been the slower than expected pace of demand growth. The robust increase in U.S. oil production, along with Canada, Brazil and Libya, has largely offset the majority of the oil taken off the market per the deal. OPEC also recently upwardly revised its outlook for Canadian and Brazilian output, which will put further pressure on oil as it tries to break out as the busy summer driving season in the U.S. approaches. I see the extension of the output deal as a given and already priced into the market. Only a surprise cut in production below the existing quota would give oil a sustainable boost when the extension is confirmed. The EIA sees U.S. oil production soaring in 2018 to 9.96 million barrels per day. It won’t be too long afterwards that the U.S. will become the permanent oil production leader in the world.
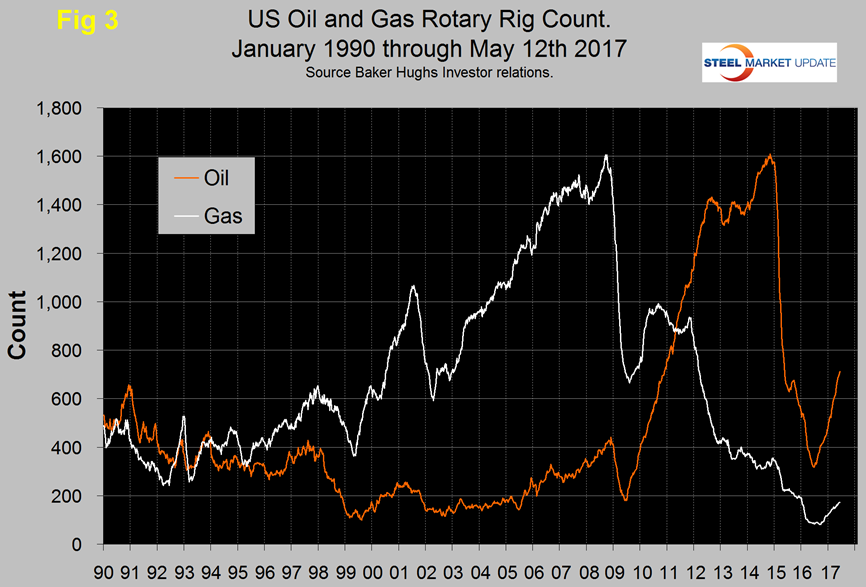
The total number of operating rigs in the US on May 12th was 885, and has risen steadily since its low point of 404 on May 27th 2016. The oil rig count had a low point of 316 also on May 27th last year and has since risen by 125 percent to 712 on May 12th. The US gas rig count has risen from its low point of 81 on August 5th last year to 172 on May 12th, an increase of 112 percent. The y/y growth rate of US plus Canadian total rigs was 116 percent in the latest data. Figure 3 shows the Baker Hughes US Rotary Rig Counts for oil and gas equipment in the US (Explanation below).
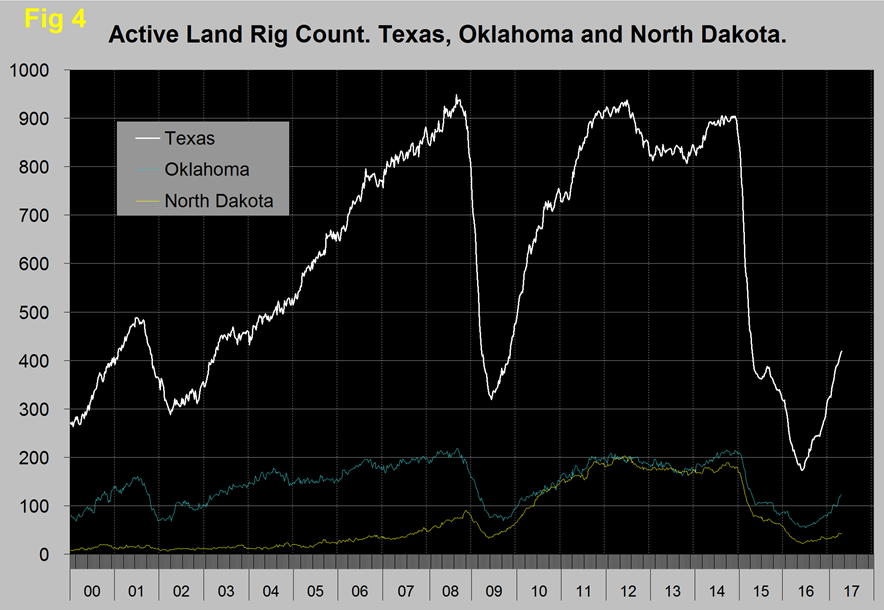
On a regional basis in the US, the big three states for operating rigs are Texas, Oklahoma and North Dakota. Figure 4 shows the land rig count in those states since 2000 and that non-conventional drilling in North Dakota is down by 75 percent from its heyday in late 2014. This is not as bad as it sounds because previously drilled and capped wells are being put back on stream.
Acting Under Secretary of Commerce for International Trade Ken Hyatt issued a new report on May 1st that predicts increases in global oil and gas prices will drive a revival of U.S. oil and gas equipment exports during the next four years. The report was released at the Offshore Technology Conference in Houston. The study finds that a five-year downward trend that followed slumping oil prices should reverse itself in 2017, as new drilling opportunities in foreign deep water and shale formations become more economically viable. “Now that oil prices are up, the industry is reinvigorated and new export opportunities are emerging as a result,” Hyatt said. “We expect a significant level of growth in this important sector, leading to additional U.S. exports and job creation.” The United States is the world’s fourth largest exporter of oil and gas equipment with close to $18 billion in export sales, or 11 percent of the $166 billion global market. According to the report, the total world market for oil and gas equipment should increase to $205 billion in 2020 – an increase of nearly 23.5 percent. The report notes that American exporters must deal with regulatory and legal constraints “that threaten to inhibit greater global trade in some strategic markets.” U.S. oil and gas equipment producers face stiff competition from companies in China, Germany, and South Korea. Canada remains the largest foreign export market for U.S. oil and gas equipment manufacturers, followed by Mexico, United Kingdom, Norway, Brazil, Netherlands and Nigeria.
About the Baker Hughes Rotary Rig Count: These are a weekly census of the number of drilling rigs actively exploring for or developing oil or natural gas in the United States. Rigs are considered active from the time they break ground until the time they reach their target depth and may be establishing a new well or sidetracking an existing one. The Baker Hughes Rotary Rig count includes only those rigs that are significant consumers of oilfield services and supplies.

Peter Wright
Read more from Peter WrightLatest in Environment and Energy

DOE transformer rule to benefit Cliffs’ electrical steel
The US Department of Energy has finalized Congressionally mandated energy-efficiency standards for transformers.
SMA: US steelmakers deserve credit for leading decarbonization charge
When it comes to finding ways to reduce emissions in steel manufacturing, we are in the all-of-the-above camp.
AISI explains new PM2.5 air-quality regulation’s impact on steel
The US already had strict regulations on air-quality standards for particulate matter, but they are going to get even tighter.
Stricter EPA air-quality standards could hit steel
The US Environmental Protection has announced more stringent air quality standards that could impact domestic steel producers.
SunCoke earnings recover in Q4, posts full-year gains
SunCoke Energy Inc.’s earnings improved in the fourth quarter, driven by higher coal-to-coke yields, the company said in its Q4, and full-year results on Feb. 1.