
Steel Products Prices North America

Imports Grab Greater Share of Sheet Demand
Written by Peter Wright
August 10, 2017
Editor’s note: As a special bonus, we are sharing this premium-level article with all our subscribers:
Demand for sheet products is increasingly driven by hot rolled coil. Imports are taking a greater share of the sheet market, reaching 21.2 percent in June.
Apparent supply is a proxy for market demand, and the apparent supply of hot rolled coil has been growing strongly this year. Imports continue to be an increasing factor in the sheet markets. There is a major difference in import market share for the four major sheet products with HRC at 11.7 percent and OMC (other metallic coated) at 54.0 percent.
This report summarizes total steel supply from 2003 through June 2017 and year-on-year changes. It then compares domestic mill shipments with total supply to the market. It quantifies market direction by product and enables a side-by-side comparison of the degree to which imports have absorbed demand. Sources are the American Iron and Steel Institute and the Department of Commerce with analysis by SMU.
Table 1 describes both apparent supply and mill shipments of sheet products (shipments includes exports) side by side as three-month averages through June, for both 2016 and 2017. Apparent supply is a proxy for market demand. Comparing these two periods, total supply to the market was up by 1.1 percent, but mill shipments were down by 0.4 percent. The fact that supply was up and mill shipments were down means that imports were more of a factor in the market compared to the same three months last year. Table 1 breaks down the total into product detail and shows that supply grew by more than shipments for every product except HRC, which was a repeat of our April and May conclusions. Electrogalvanized is an oddball because it has net exports.
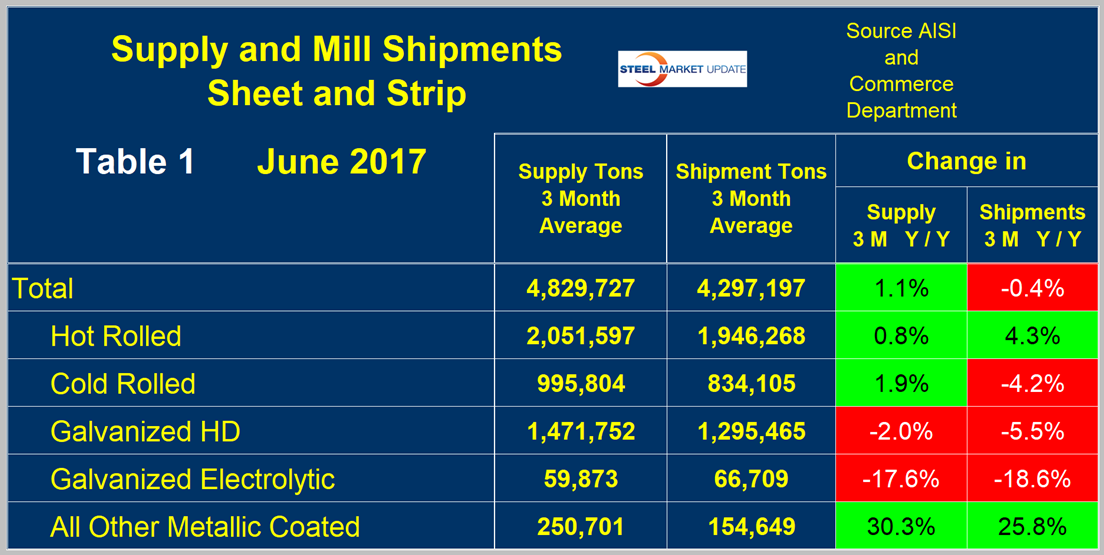
Below is a review of supply and shipments separately for individual sheet products.
Apparent Supply
Apparent supply is defined as domestic mill shipments to domestic locations plus imports. In the three months through June 2017, the average monthly supply of sheet and strip was 4.83 million tons, up by 1.1 percent compared to the same period ending June 2016 (year/year). In the three months through June compared to the three months through March, supply was up by 2.5 percent. The short-term increase (three months) compared to the long-term improvement (12 months) means that through June momentum was positive. There is no seasonal manipulation of any of these numbers. By definition, year/year comparisons have seasonality removed, but 3m/3m comparisons do not. Table 2 shows the change in supply by product on this basis through June. Momentum was very positive for HRC, but CRC had zero growth in the second quarter compared to the first quarter. OMC slowed substantially, but still had 13.5 percent growth in three months through June compared to three months through March.
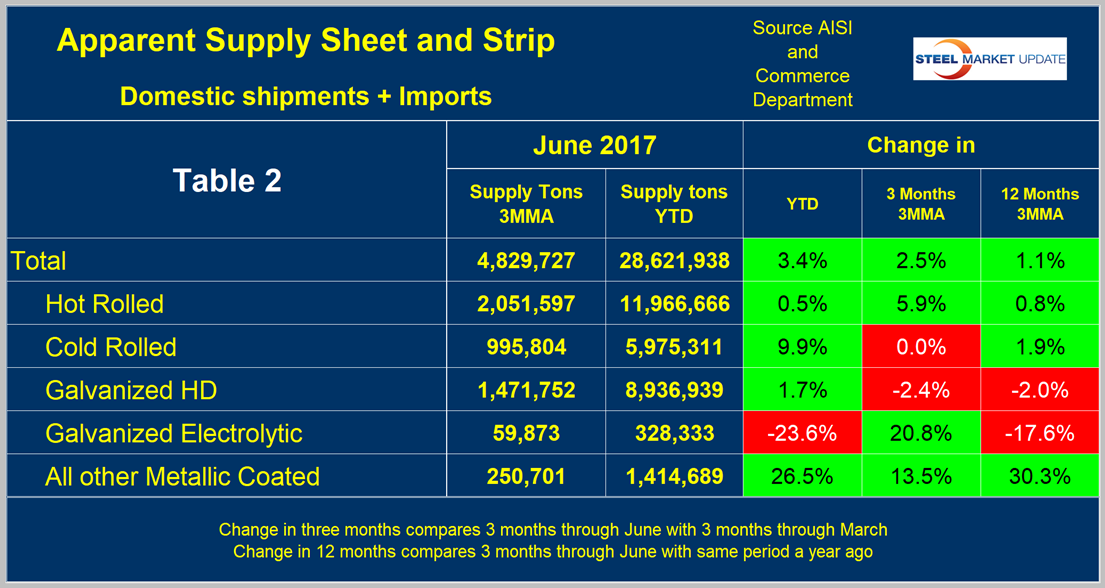
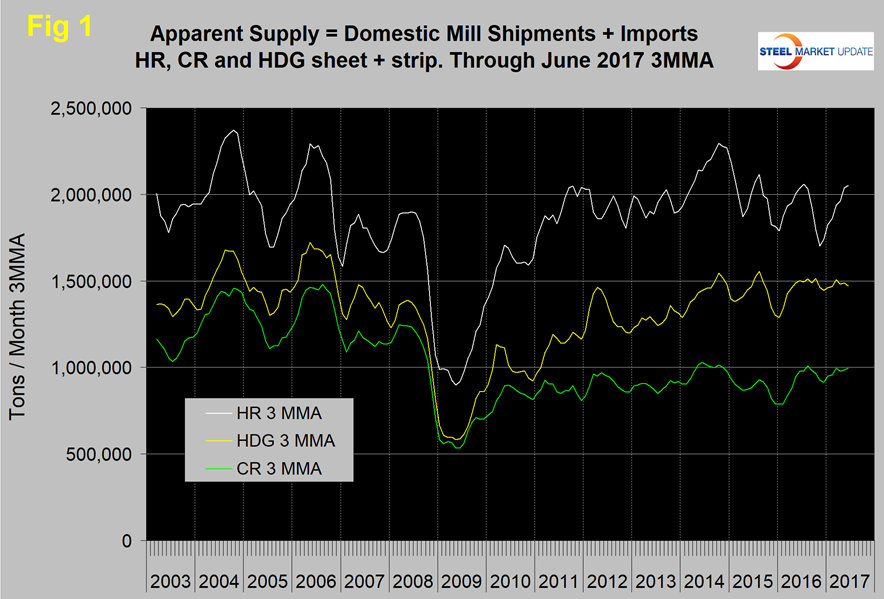
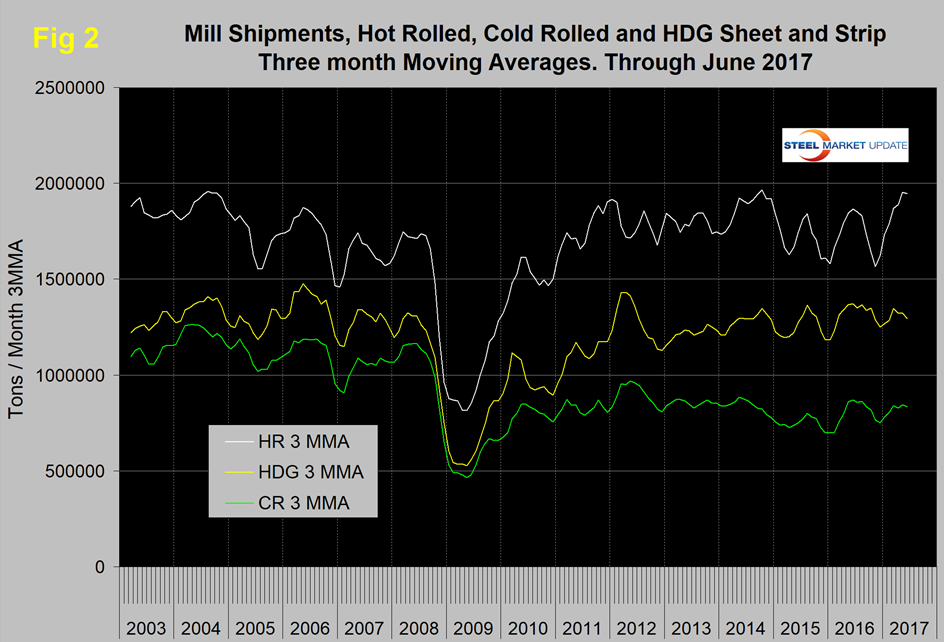
Figure 1 shows the long-term supply picture for the three major sheet and strip products, HRC, CRC and HDG, since January 2003 as three-month moving averages. HRC has performed very well this year, cold rolled has had some improvement, but HDG has made no progress in more than a year.
Mill Shipments
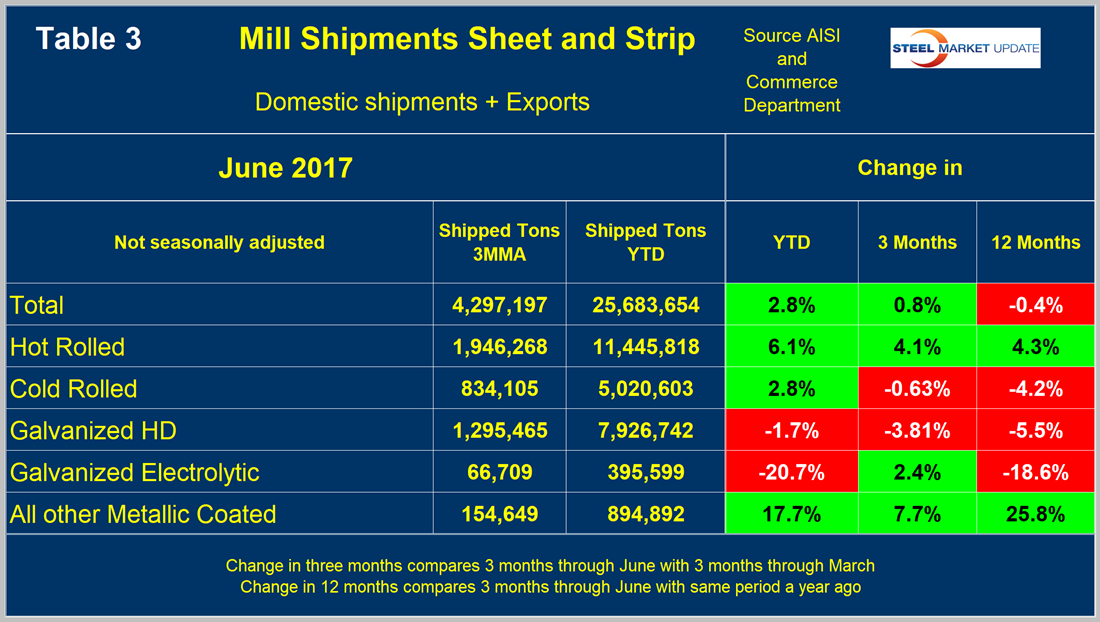
Table 3 shows that total shipments of sheet and strip products including hot rolled, cold rolled and all coated products were down by 0.4 percent in three months through June year over year and up by 0.8 percent comparing three months through June with three months through March.
Overall, momentum was positive for sheet through June, but was very mixed for individual sheet products. Figure 2 puts the shipment results for the three main products into the long-term context since January 2003.
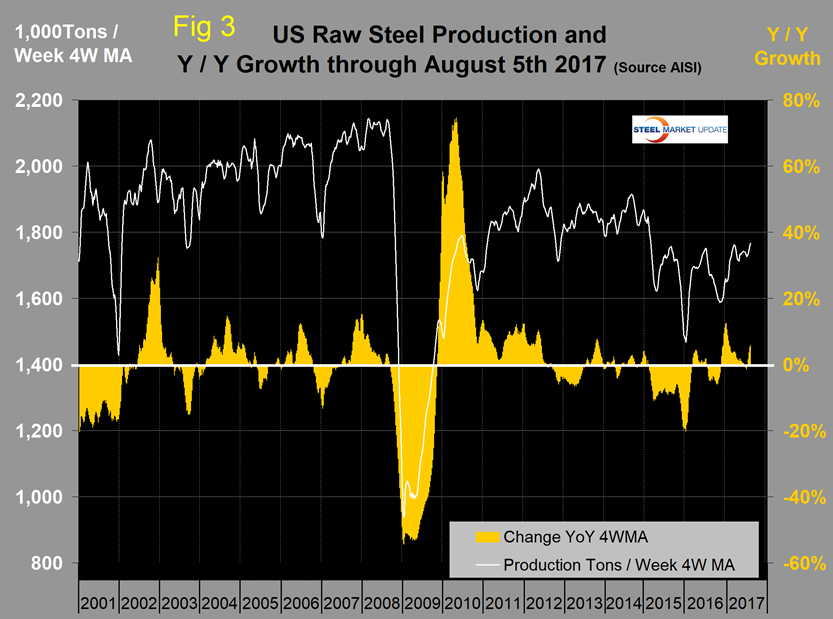
SMU Comment: A problem with this data is that it’s now well into August and the latest information we have for shipments and supply is for June. The AISI puts out weekly data for crude steel production, the latest for which was the week ending Aug. 5. This provides the most current data for steel mill activity. Figure 3 shows the year/year change in weekly crude output on a four-week moving average basis. Growth became positive year/year in the week ending Nov. 19 last year, was positive for 30 weeks, but slowed to zero in the week ending July 8. In the last four weeks, year/year growth has been increasingly positive and reached 5.9 percent in the week ending Aug. 5. Licensed imports through July show a surge in the latest data, with positive growth every month since February. The import market share of all sheet products except HDG increased in June. Based on the strength of the economic indicators analysis that SMU performs and our proprietary measure of buyer sentiment, we are expecting demand for sheet products to continue to increase through the third quarter.

Peter Wright
Read more from Peter WrightLatest in Steel Products Prices North America
Nucor holds HR price steady this week
Nucor is holding its hot-rolled (HR) coil consumer spot price (CSP) flat this week.
SMU price ranges: Sheet, plate largely unchanged
Sheet prices varied this week. While hot-rolled (HR) coil pricing was largely flat, cold-rolled (CR) coil and tandem product pricing eased slightly reflecting the momentum shift seen last week for HR coil. SMU’s average HR coil price was flat from last week at $835 per short ton (st) – potentially emphasizing the tension between competing […]
Nucor posts $830/ton spot HR price for week of April 8
Nucor said its spot hot-rolled (HR) coil price this week will be $830 per short ton (st).
US HR prices rebound, no longer near parity with imports
US hot-rolled coil and offshore hot band moved further away from parity this week as stateside prices have begun to move higher in response to mill increases.
Galvanized buyers report solid demand, balanced inventories
Galvanized buyers reported solid demand and balanced inventories this week and were anticipating the sheet price increase announced by Cleveland-Cliffs on Wednesday.