Product
February 27, 2013
Chicago Fed National Activity Index as Leading Indicator to Steel Supply
Written by John Packard
Written by: Peter Wright
Chicago Fed national Activity Index, (CFNAI) is a widely respected measure of both overall and detailed economic activity in the US. The index’s three-month moving average, increased to +0.30 in January from +0.23 in December. Given the substantial upward revisions for November and December, January’s result marked the third consecutive reading above zero, (Figure 1 below). Additionally, January’s reading suggests that growth in national economic activity was somewhat above its historical trend. The economic growth reflected in this level of the CFNAI suggests limited inflationary pressure from economic activity over the coming year.
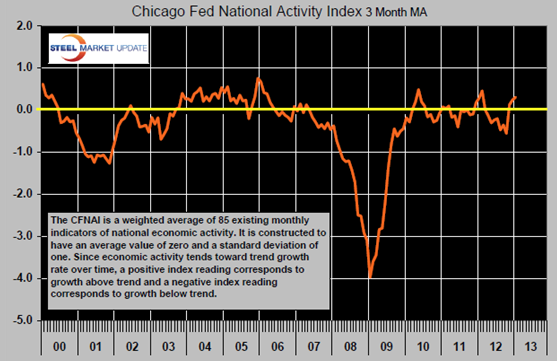
The CFNAI is a weighted average of 85 monthly indicators of national economic activity. It is constructed to have an average value of zero and a standard deviation of one. Since economic activity tends toward trend growth rate over time, a positive index reading corresponds to growth above trend and a negative index reading corresponds to growth below trend.
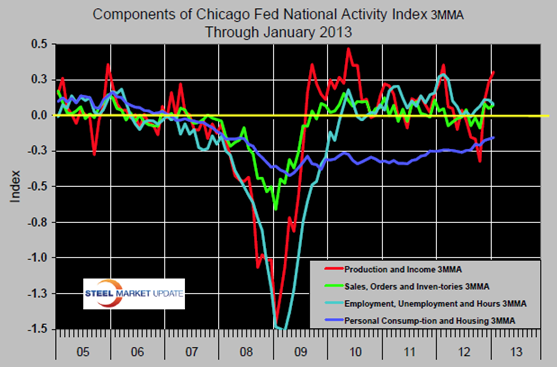
The 85 economic indicators that are included in the CFNAI are drawn from four broad categories of data: production and income; employment, unemployment, and hours; personal consumption and housing; and sales, orders, and inventories. Each of these data series measures some aspect of overall macroeconomic activity. The derived index provides a single, summary measure of a factor common to these national economic data. On a three month moving average basis, production and income have increased strongly since September, personal consumption and housing has been improving steadily since mid 2011 (Figure 2 Below).
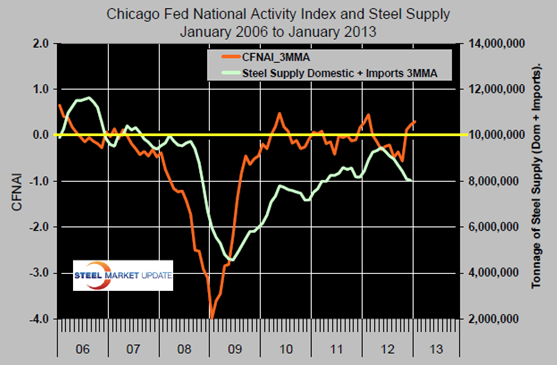
The CFNAI is a useful leading indicator of the apparent supply of all steel products with a lead of about six months, (Figure 3 below). The suggestion at present is that steel supply is below true market demand. It is well established that the volatility of steel supply is much greater than that of GDP. This is probably due to inventory control at all levels of the supply chain. Based on the first estimate of GDP in Q4 2012, economic activity shrank by 0.1 percent which by historical precedent would have led to a reduction of inventories nationwide. The second estimate of Q4 GDP growth will be released on Thursday this week. Based on revisions made to the growth of GDP in Q3 there may be a positive revision to the Q4 estimate. Stay tuned!