Steel Products
AK Steel & SMU + CRU Graphic
Written by John Packard
March 13, 2013
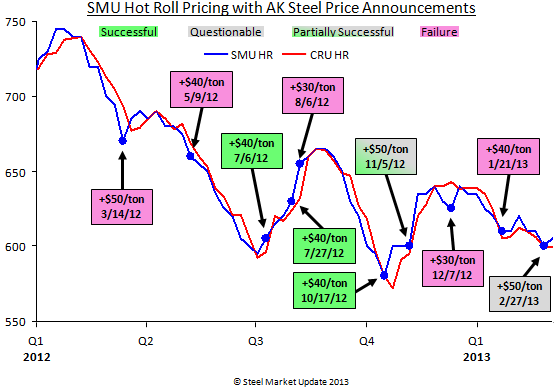
We had a couple of readers ask how our graph would look if we used the CRU hot rolled price assessments versus our own. As you can see by the updated graph there can be some variations between CRU and SMU HRC price assessments but, essentially we follow the same track. The blue line is Steel Market Update hot rolled coil averages while the red line is the CRU HRC index.

John Packard
Read more from John PackardLatest in Steel Products

Domestic mill shipments rise in June: AISI
US steel shipments increased month over month and year over year in June, according to the latest figures from the American Iron and Steel Institute (AISI).

Active rig counts slipped in US, Canada
Drilling activity slowed in the US and Canada last week, according to the latest oil and gas rig count data released by Baker Hughes.

OCTG producers in Canada take aim at Mexico, US, others
Evraz NA and Welded Tube of Canada have lodged an unfair trade complaint against imports of OCTG, including those from USMCA trading partners Mexico and the US.

Final Thoughts
The difference: The spat with Turkey was a big deal for steel. This time, the 50% reciprocal tariff for Brazil – if it goes into effect as threatened on Aug.1 – hits everything from coffee and to pig iron. It seems almost custom-built to inflict as much pain as possible on Brazil.

CRU: US rebar and wire rod prices rise alongside S232 increase
CRU Senior Steel Analyst Alexandra Anderson discusses current market and pricing dynamics for long steel products in the US.