Prices

September 19, 2014
Global Steel Production and Capacity Utilization in August 2014
Written by Peter Wright
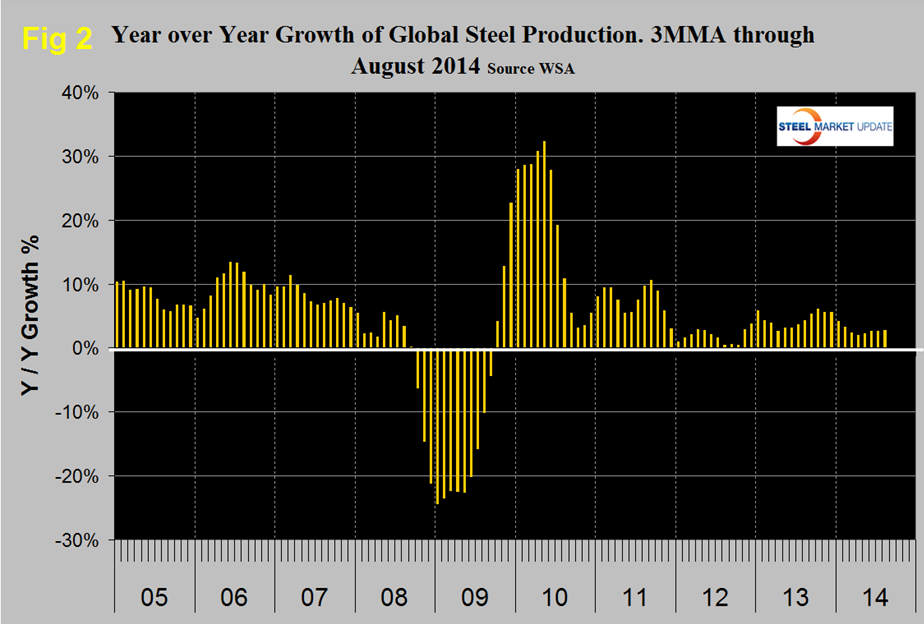
Production in August on a tons per day basis was 4.342 million tonnes, down from 4.424 in July. This was the second month since February when production was <4.5 million metric tons per day. This is a seasonal effect, since January 2008 on average, August production has declined by 1.76 percent from July. This year August declined 1.86 percent from July. The three month moving average (3MMA) of production in August on an annualized basis was 1.639 billion tons and a capacity utilization of 76.2 percent, (Figure 1).
Capacity is now 2.076 billion tons. Table 1 shows regional production in the single month of August with regional share of the global total, also three months production through August and YTD production. Regions are shown in white font and individual nations in beige.
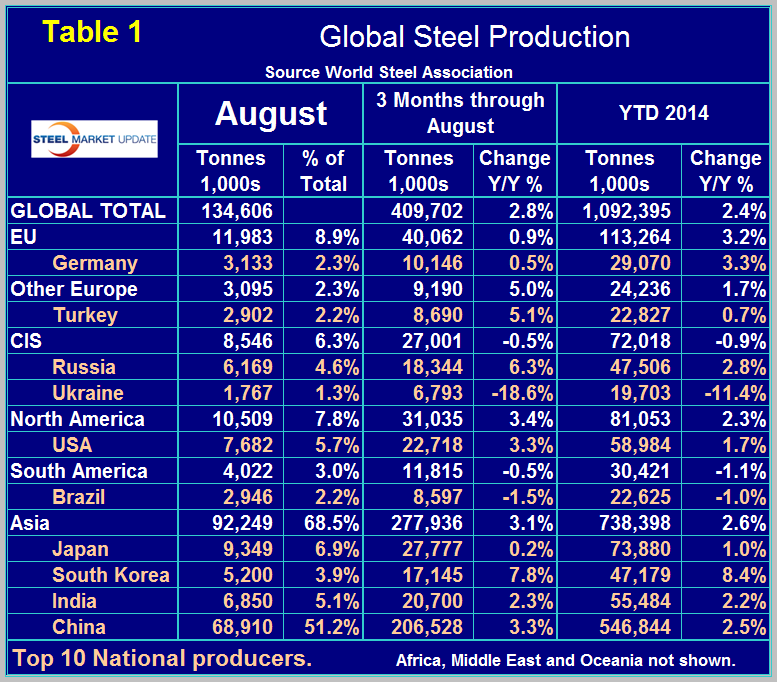
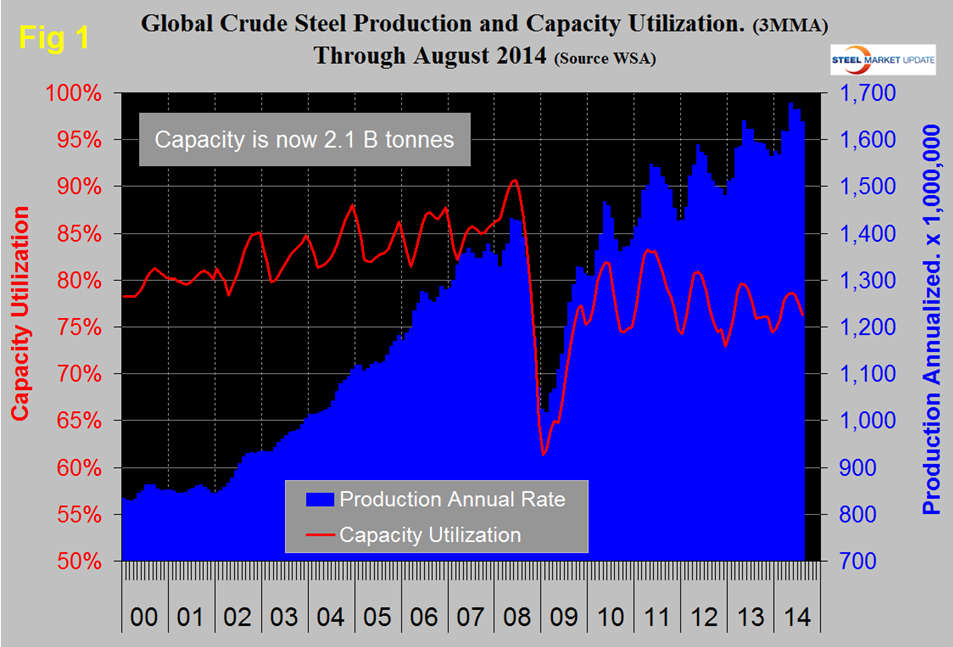
In three months through August year over year (y/y) global growth was 2.8 percent, year to date growth was 2.4 percent. Both measures were up slightly from July. All regions except the CIS and South America had positive y/y growth in three months through August. The effect of the war in Ukraine is clear in the contraction of that country’s steel production. This must be affecting the supply of semi-finished to Turkey and consequently affecting the scrap market. The European Union which had the fastest growth rate in early 2014 continued to slow and achieved only 0.9 percent in three months through August. Year over year growth of output in the NAFTA was 3.4 percent in three months through August with the US at 3.3 percent. Canada achieved 8.9 percent and Mexico 1.4 percent. South America had negative 0.5 percent growth through August with its largest producer, Brazil down by 1.5 percent. Growth in Asian production was 3.1 percent once again led by South Korea at 7.8 percent. In the single month of August, China’s production grew by 4.0 percent year over year and achieved an astonishing, (and maybe unbelievable) 51.2 percent share of the global total. The 3MMA growth of China’s production through August was of 3.3 percent which exceeded the global total by 0.5 percent. North America produced 7.8 percent of the global total in August. Figure 2 shows that the year over year growth of global production has steadily increased from 2.0 percent in April to 2.8 percent in August. (Source: World Steel Association)