

Market Data

September 25, 2014
Durable Goods Analysis for August 2014
Written by Peter Wright
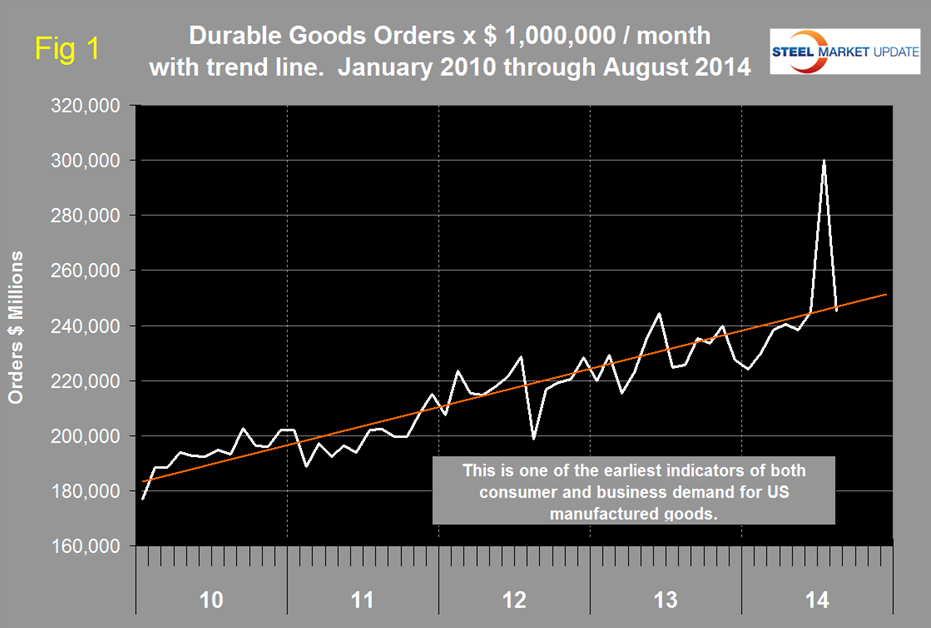
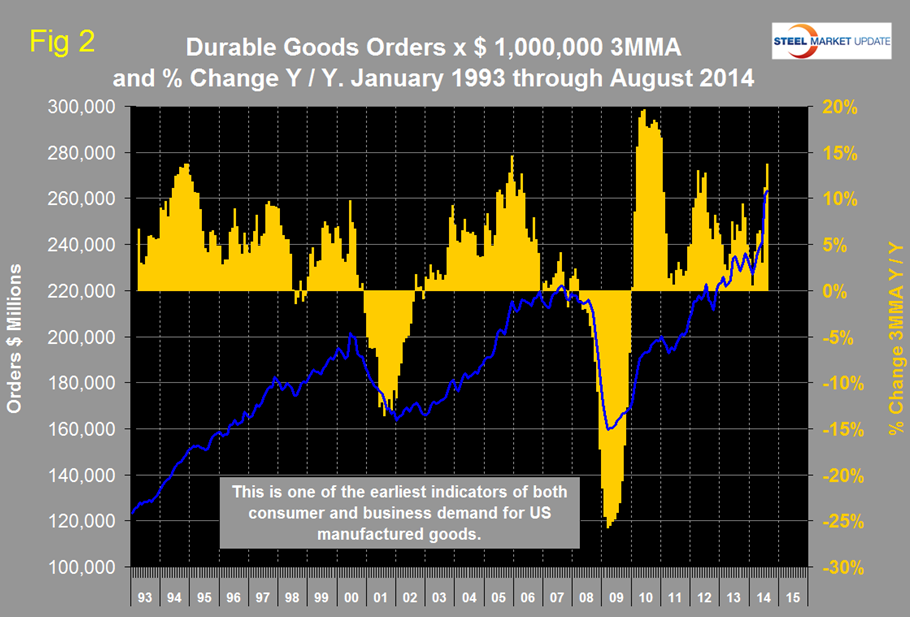
Durable goods orders in August fell back to the long term trend line after the huge surge in July, continuing the healthy trend that has existed since the recession (Figure 1). The three month moving average (3MMA) increased for the sixth straight month (Figure 2). The year over year growth rate of the 3MMA grew at 13.8 percent, its best performance since January 2011 but this is misleading because July was such an unusual month for civil aircraft orders.
Moody’s Economy.com reported as follows: “New orders for durable goods slid 18.2 percent in August, a sharp but expected decline following their 22.5 percent surge in July. A 42 percent drop in transportation orders drove the headline number lower, as details of the report beyond transportation were relatively upbeat. New orders excluding transportation gained 0.7 percent, and new orders for core capital goods added 0.6 percent. Shipments data were also mired by transportation-related details; total shipments fell 1.5 percent, but excluding transport and core capital goods shipments both rose 0.1 percent.
Our belief that 2014 will be a good year for investment is unchanged. Core capital goods shipments are key source data used by the government to estimate equipment spending in the GDP accounts, and the latest data suggest a pickup in real equipment spending growth. Capital investment is essential to long-term gains.
Stabilizing equipment purchases are good for growth in coming years, but firms are just now getting back to the pace of investment that prevailed in the middle of last year. Manufacturers have added to payrolls every month this year, and fundamentals favor additional investment and hiring in the coming months.
The Census Bureau press release issued today read as follows: New orders for manufactured durable goods in August decreased $54.5 billion or 18.2 percent to $245.4 billion, the U.S. Census Bureau announced today. This decrease, down following two consecutive monthly increases, followed a 22.5 percent July increase. Excluding transportation, new orders increased 0.7 percent. Excluding defense, new orders decreased 19.0 percent. Transportation equipment, also down following two consecutive monthly increases, drove the decrease, $55.6 billion or 42.0 percent to $76.8 billion.
Shipments of manufactured durable goods in August, down following two consecutive monthly increases, decreased $3.7 billion or 1.5 percent to $246.1 billion. This followed a 3.7 percent July increase. Transportation equipment, also down following two consecutive monthly increases, drove the decrease, $3.9 billion or 5.1 percent to $72.5 billion.
Unfilled orders for manufactured durable goods in August, up sixteen of the last seventeen months, increased $7.4 billion or 0.6 percent to $1,165.0 billion. This was at the highest level since the series was first published on a NAICS basis in 1992 and followed a 5.3 percent July increase. Transportation equipment, up eleven of the last twelve months, led the increase, $4.3 billion or 0.6 percent to $742.1 billion.
Inventories of manufactured durable goods in August, up sixteen of the last seventeen months, increased $1.7 billion or 0.4 percent to $403.0 billion. This was at the highest level since the series was first published on a NAICS basis and followed a 0.4 percent July increase. Transportation equipment, also up sixteen of the last seventeen months, led the increase, $0.6 billion or 0.4 percent to $129.9 billion.
Non-defense new orders for capital goods in August decreased $49.5 billion or 36.3 percent to $86.8 billion. Shipments increased $0.1 billion or 0.2 percent to $79.7 billion. Unfilled orders increased $7.1 billion or 1.0 percent to $731.8 billion. Inventories increased $0.6 billion or 0.3 percent to $184.1 billion. Defense new orders for capital goods in August increased $0.4 billion or 5.4 percent to $8.8 billion. Shipments increased $0.1 billion or 0.9 percent to $9.7 billion. Unfilled orders decreased $0.9 billion or 0.6 percent to $158.3 billion. Inventories increased $0.1 billion or 0.5 percent to $23.9 billion.


