Market Data

October 12, 2014
SMU Survey Results: Steel Demand
Written by John Packard
Steel Market Update conducted our early October flat rolled steel market survey this past week and the results are available in a power point format for our Premium level members on our website. The power point is also shared with those who completed the survey.
As with past surveys, SMU invited just over 600 people representing approximately 580 companies to participate in our survey. Those who click on the link in our invitation email are sent to SurveyMonkey.com which hosts our surveys. Once there, the group is asked a number of general business questions before being broken out by market segment to respond to industry specific questions.
Of those taking the survey last week, 45 percent of the respondents were manufacturers, 41 percent were service centers, 7 percent trading companies, 4 percent steel mills and the remaining 3 percent were toll processors. There were no suppliers to the industry responding to last week’s survey invitation (this would include chemical, paint companies, etc.). Our normal response rate is 100-170 per survey.
As a group we ask about demand and if demand for their company’s products and services is improving, declining or remaining the same. The majority of those responding this past week reporting demand as remaining the same (62 percent) with 26 percent reporting demand as improving and 12 percent as declining. The power point provided to our Premium level members compares the results with what we measured at the beginning of September and August. There has been a relatively large shift in the results from July to now. In early July, 40 percent referenced demand as improving and only 4 percent referenced demand as in decline.
We also break out demand by market segment. In particular we look at demand out of the manufacturing companies as key. We expand the options available when we ask manufacturers how demand will be for their products over the next 3 months based on current order flows. The options are: increase substantially, increase marginally, remain the same, decline marginally and decline substantially. Here is what we learned:
The largest percentage was those who see demand over the next 3 months remaining the same as it is currently. The next largest segment were those responding that demand was going to improve either marginally (32 percent) or substantially (2 percent), while 25 percent reported that demand at their company would decline marginally during the next 3 months.
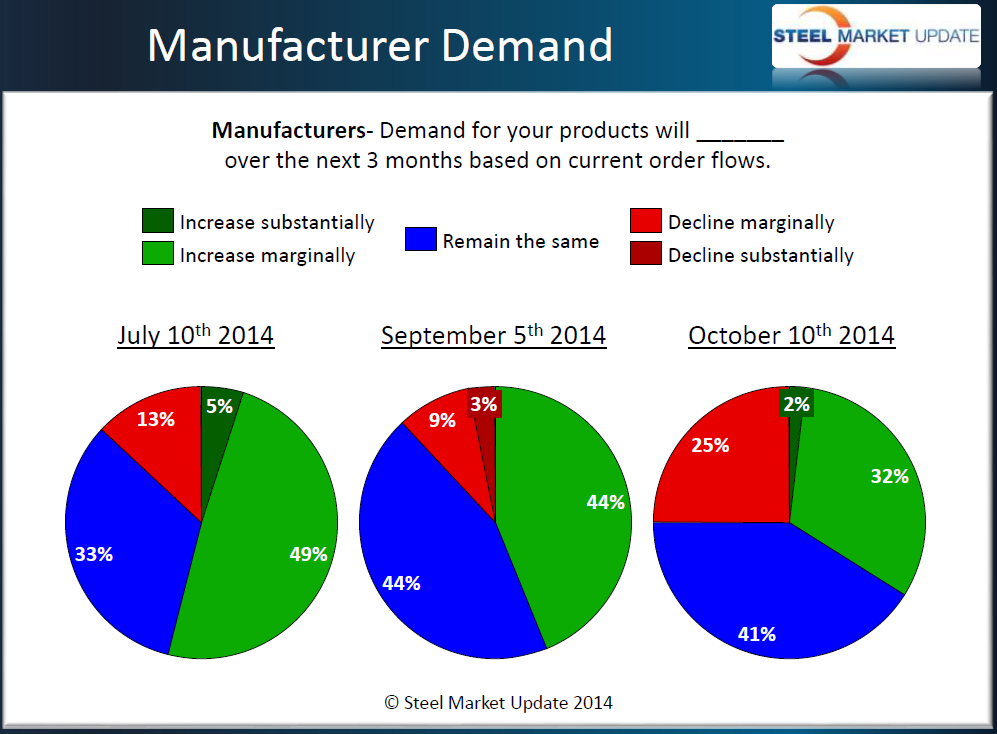
Out of curiosity we went back and look at the survey power point history (which is now on the website and available to our Premium level members) to see what our respondents were reporting one year ago. Last October we had 40 percent of the respondents reporting manufacturing demand as remaining the same while 28 percent reported that demand would decline marginally and 4 percent decline substantially. This left 20 percent who reported demand as improving marginally and 8 percent responding that demand would improve by a substantial amount over the next 3 months.
Manufacturing companies are slightly more optimistic this year than last as 75 percent are reporting either stable or growing demand this year versus 68 percent last year.
Service centers confirmed what we learned from the manufacturing companies. We asked the distributors if their end user customers were releasing more steel this year than last. We found 44 percent responded that releases remained the same, another 44 percent reported releases were higher than one year ago, and the balance (12 percent) reported releases as being lower than one year ago.