Market Data

January 21, 2015
SMU Service Center Apparent Excess/Deficit Forecast
Written by John Packard
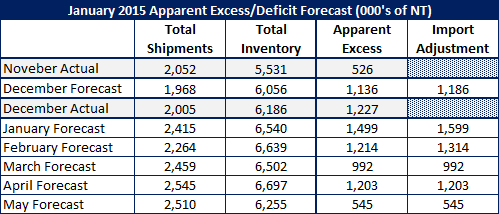
Steel Market Update nailed (for lack of a better term…) our service center apparent excess shipment forecast which we provided to our Premium level members this past month. Based on an expectation that flat rolled carbon steel shipments would be up by 2 percent over total shipments for December 2013, we predicted shipments would be 1,968,000 tons and MSCI final December shipments actually totaled 2,005,000 tons.
We missed hitting the shipment number by 37,000 tons (our apologies, we will try to do better this month).
![]() Last month we forecast that total steel receipts for the month of December would be 6,056,000 tons. The actual receipts according to the MSCI data released earlier this week were 6,186,000 tons. To that number we added a foreign steel inventory adjustment of 50,000 tons which took our number up to 6,106,000 tons or -80,000 tons shy of the MSCI final number.
Last month we forecast that total steel receipts for the month of December would be 6,056,000 tons. The actual receipts according to the MSCI data released earlier this week were 6,186,000 tons. To that number we added a foreign steel inventory adjustment of 50,000 tons which took our number up to 6,106,000 tons or -80,000 tons shy of the MSCI final number.
In the table below, we are providing our latest service center inventory and shipment forecast for the next 5 months. Our forecast is based on the following premise:
Shipments, which were up 3.8 percent during the January through May 2014 versus the same period the previous year (Jan-May 2013), would exceed 2014 levels by 2 percent. We believe the energy crisis which is impacting OCTG, line pipe and possibly other products would decrease shipments by about 1 percent during this time period. Total shipments of U.S. service center flat rolled are projected to be 2,415,500 tons for the month of January.
Receipts are projected to be up 5 percent during January 2015 vs. 2014. We have also made an inventory adjustment of 100,000 tons to accommodate excess foreign inventories. Total receipts for the month of January are forecast to be 2,769,500 tons.
Our forecast for the months beyond January are based on receipts being 3 percent for February, 5 percent above March and then no change in April and May to the prior month. We believe the service centers will need to correct inventories and we should see the results beginning in April and May.
This is what all of that looks like: