Market Data

January 30, 2015
Regional Job Creation - Q4 2014
Written by Peter Wright
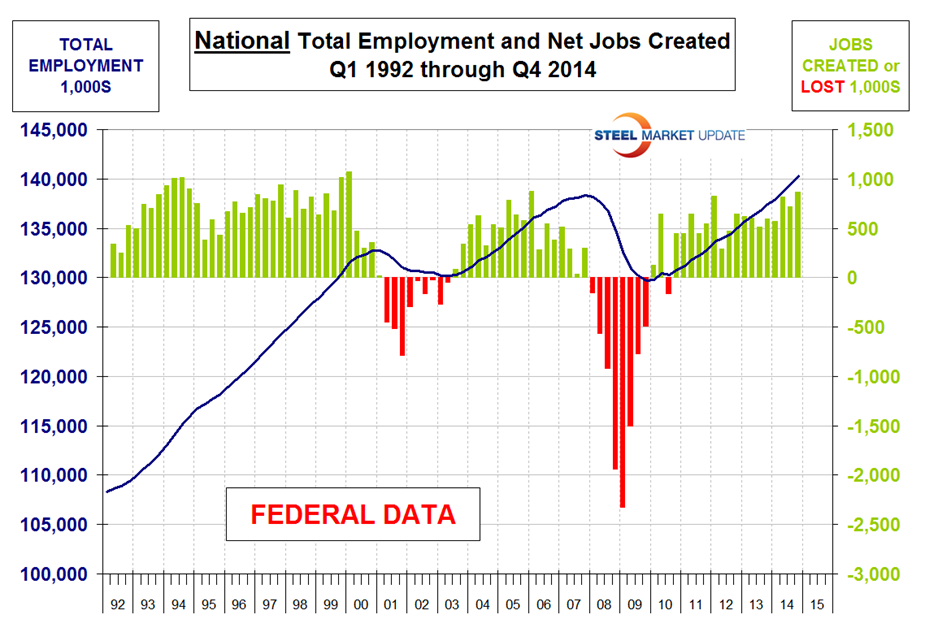
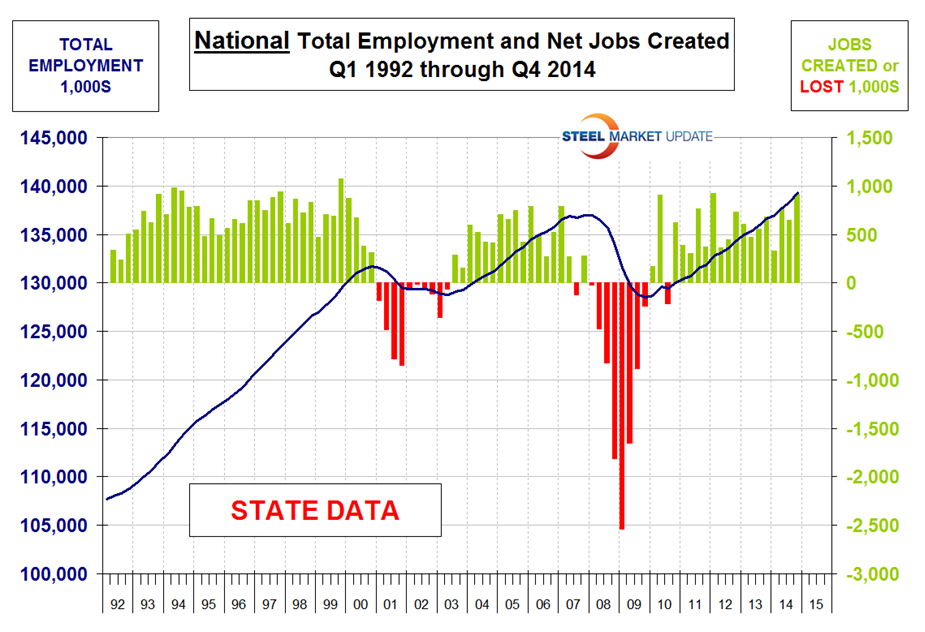
The states compile their employment numbers independently of the Feds then both are reported by the Bureau of Labor Statistics. The results are reasonably close with the Feds reporting total job creation in 2014 of 2,968,000 and the states reporting 2,664,000. Figure 1 and Figure 2 show the history of Federal and State totals since 1992. SMU has graphs in the same format for 10 geographic regions and can produce for individual states if a reader so requests.
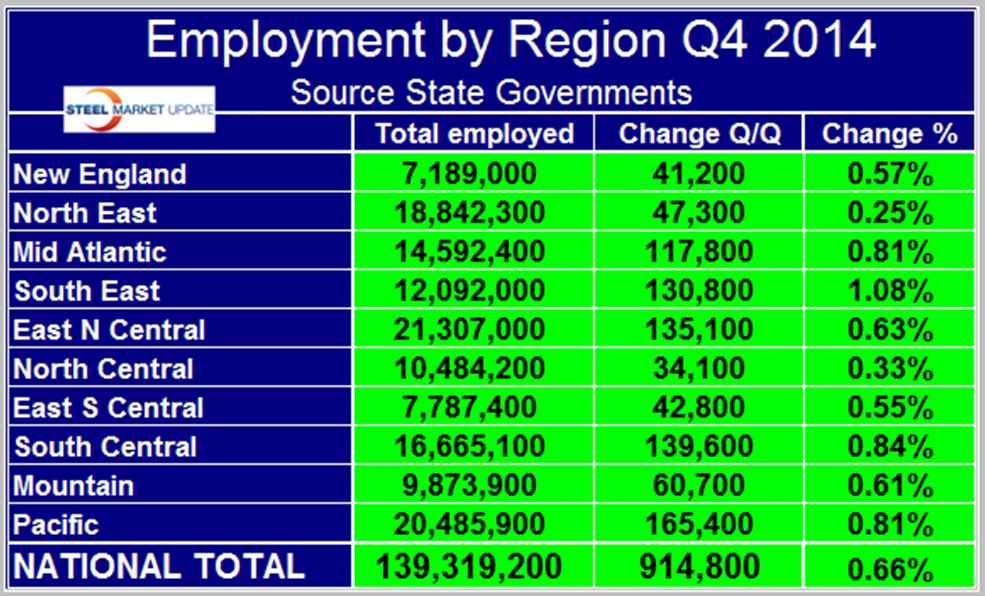
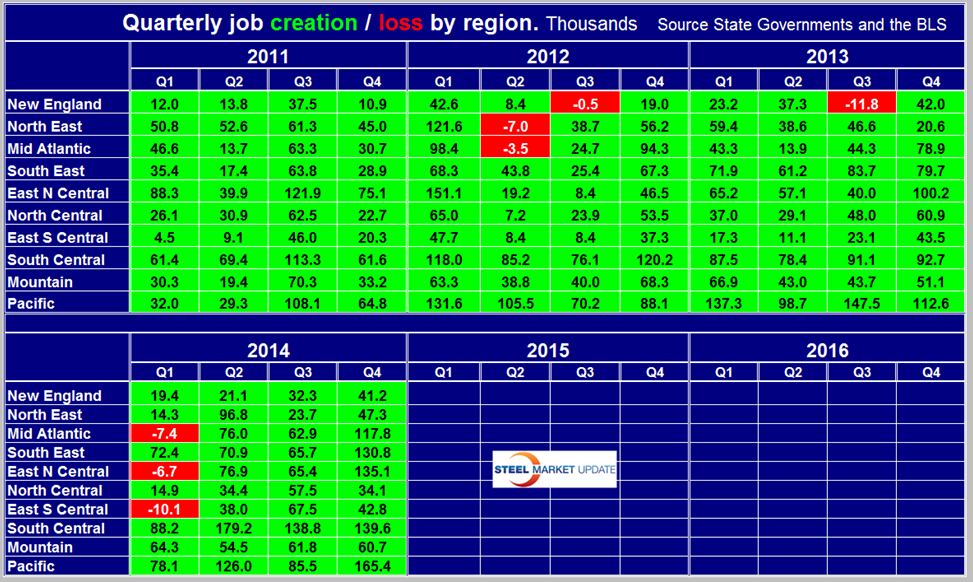
All regions had solid job creation in the 4th Q led by the Pacific, (CA, OR and WA) with an additional 165,400 positions. The South Central, (TX, OK, AR and LA followed with 139,600 positions, Table 1 shows the history of quarterly job creation by region for the last four years. Of the total jobs created in the South Central, Texas contributed 110,000. The South East, (FL and GA) had a particularly strong 4th Q with job gains almost double what they enjoyed in the previous two quarters.
The regions have fared very differently since the pre-recession high of 1st Q 2008 and since the low point of Q4 2009. There are now 2,342,000 more people employed than there were immediately before the recession but of that number 1,341,000 jobs were created in the South Central, (TX, LA, AR and OK). The East North Central, (IL, IN, MI, OH and WI) and the East South Central, (AL, KEN, MIS, and TEN) have still not recovered all the jobs lost during the recession, (Table 2). In our Q3 analysis the South East, (FL and GA) were still in negative territory but their very strong Q4 put them over the top.
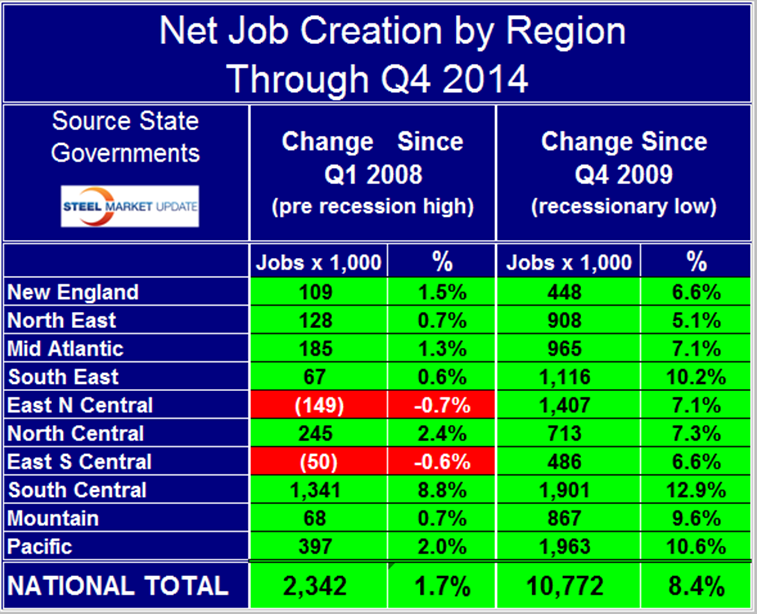
Employment is now 10,772,000 positions higher than it was at the low point of the recession. The Pacific has had the largest number of jobs created during the recovery with an increase of 1,963,000 new positions which amounts to 10.6 percent of total employment. On a percentage basis the South Central leads with an employment increase of 12.9 percent and the North East, (NY, NJ and PA) lags with 5.1 percent. The East North Central currently has the highest number of employed people with 21,307,400, followed by the Pacific with 20,486,600, (Table 3).