Market Data
February 22, 2015
Lead Times Showing Signs of Reaching the Bottom
Written by John Packard
Based on the most recent flat rolled steel market survey results, steel mill lead times stabilized this past week after having declined almost non-stop since August 2014. The question now is will the mill lead times begin to move out from here or remain stuck at these less than desirable levels (from a mill perspective anyway)?
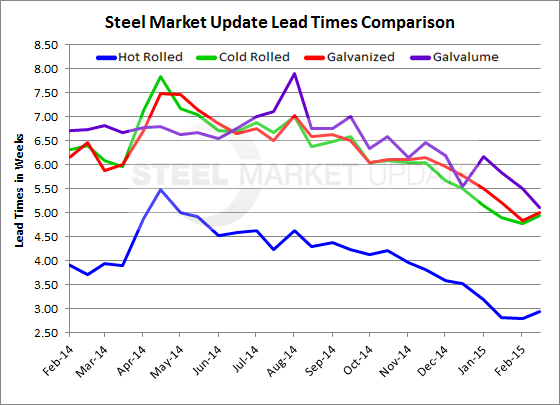
Hot rolled lead times averaged 2.93 weeks this past week. The 2.93 weeks is based on an average of all of the responses we collected for HRC lead times during the survey process this past week. For details about the companies responding to our surveys please go to our blog post regarding our Steel Buyers Sentiment Index on our website (or review the last issue of SMU).
The 2.93 weeks is slightly extended compared to the results posted at the beginning of February (2.79 weeks) but is still well below the 3.70 weeks reported during the middle of February 2014. However, as you can see by the graph below, HRC lead times appear to have bottomed out and the question is will they move out from here, especially with US Steel taking three blast furnaces out of operation in March?
Cold rolled lead times also moved out slightly from 4.77 weeks at the beginning of February to 4.93 weeks this past week. Like hot rolled above, CRC lead times appear to have bottomed and are showing the early signs of life (dead cat bounce?). Lead times one year ago were reported to average 6.40 weeks.
Galvanized lead times also are slightly more extended than what we saw just two weeks ago. Based on our most recent survey results conducted this past week the average GI lead time has moved from 4.83 weeks to 5.00 weeks. As with CRC and HRC above, galvanized lead times are still well below year ago levels when we reported the average to be 6.46 weeks.
Galvalume (zinc-alum) lead times bucked the trend and fell back last week to 5.11 weeks, down from 5.50 weeks reported at the beginning of February. The 5.50 weeks is much shorter than the 6.73 weeks reported during the middle of February 2014.
As we watch for signs of life (pricing life) lead times are one of the key ingredients to watch. As service center reduce their Apparent Excess in carbon flat rolled inventories (which SMU calculated to be 1.145 million tons in excess down from 1.227 million tons the prior month) coupled with the spread between domestic and foreign prices shrinking – we believe lead times will begin to move out. This will create a move for buyers to “get off their hands” and begin buying again. And then the cycle will begin anew….