

Analysis

May 21, 2015
NAFTA Medium and Heavy Truck Production through April 2015
Written by Peter Wright
We decided to focus on medium and heavy truck (M&HT) production this month as this sector has had little recognition in our past vehicle production reports. Interestingly M&HT production in NAFTA has been a terrific leading indicator of recessions since 1990.
Figure 1 has recessions highlighted. It seems that the planners of truck production read the tea leaves better than most.
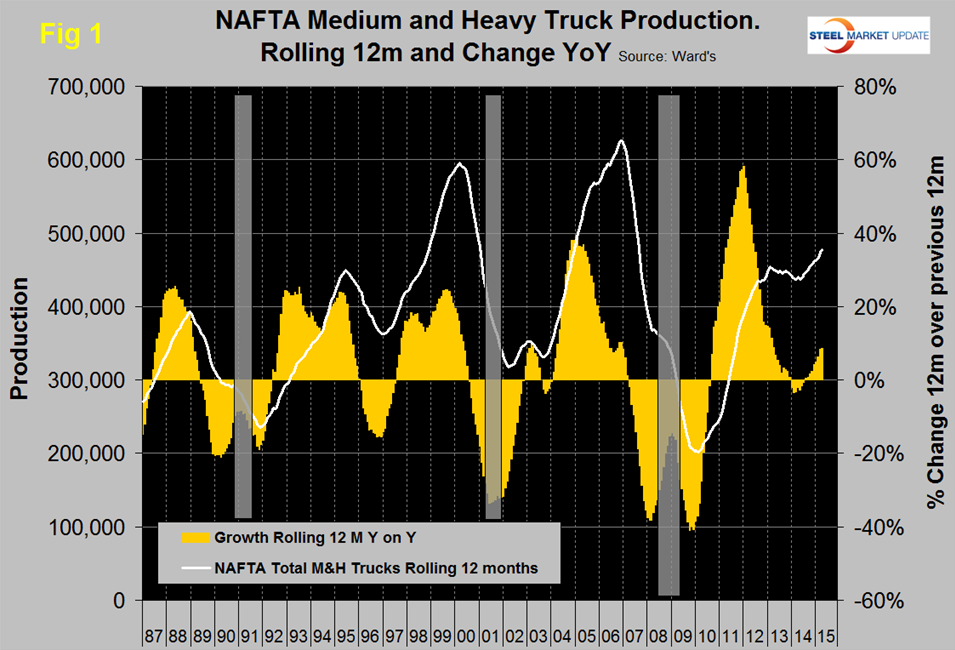
The lead time between the peak of production and the onset of recession was 22 months in 1990, 18 months in 2001 and 20 months in 2008. Readers may remember that in 1996 a recession was narrowly avoided and this also shows as a dip in M&HT production. We were concerned about the shape of the production curve in 2013 through H1 2014 but evidently this was just a hesitation. Truck production had negative year over year growth in the first half of 2014 but is now growing at an 8.6 percent rate with positive momentum.
Year to date through April, total M&HT production in NAFTA was 162,203 units which breaks down to 106,997 for the US, 3,793 for Canada and 51,413 for Mexico. Figure 2, Figure 3, and Figure 4 show total production for each nation on a rolling 12 months basis and the year over year growth rate.
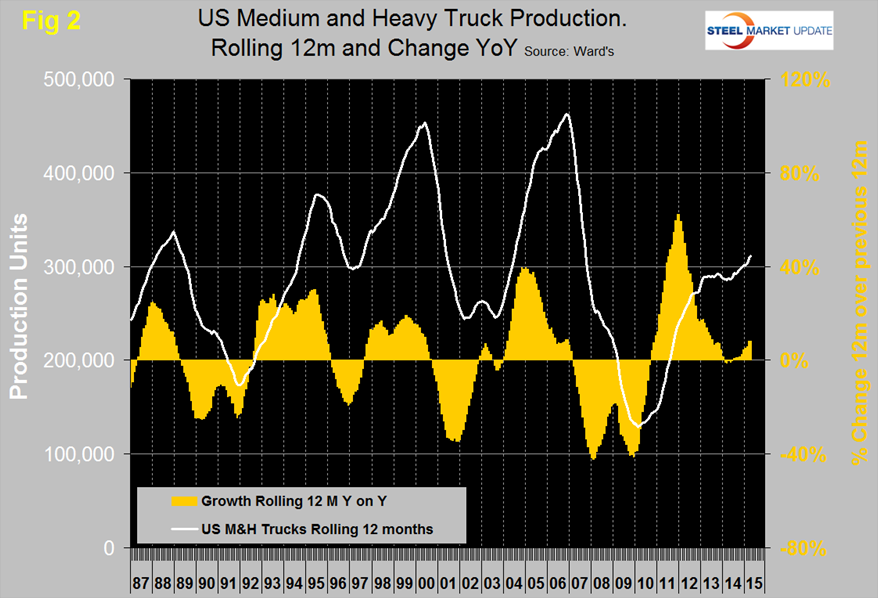
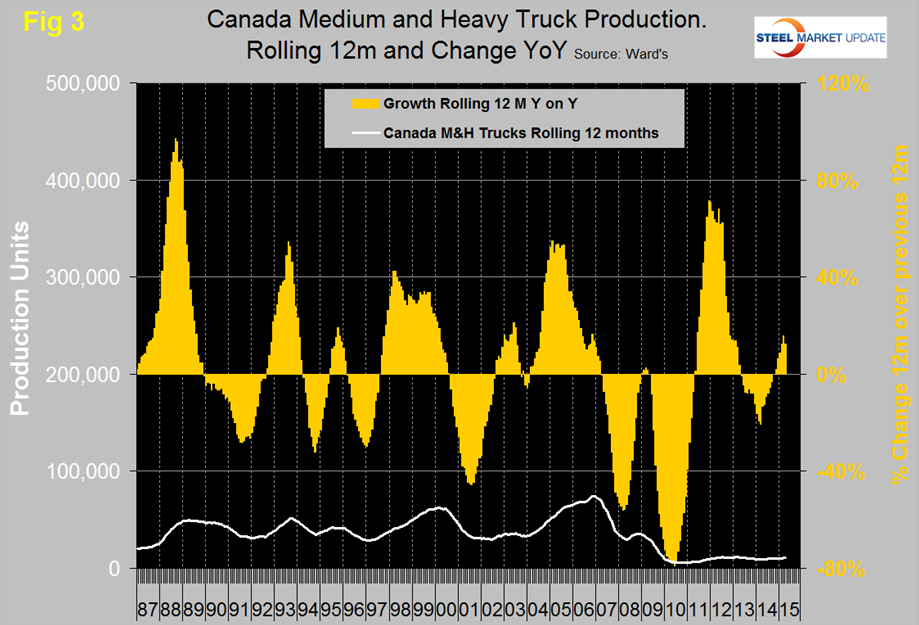
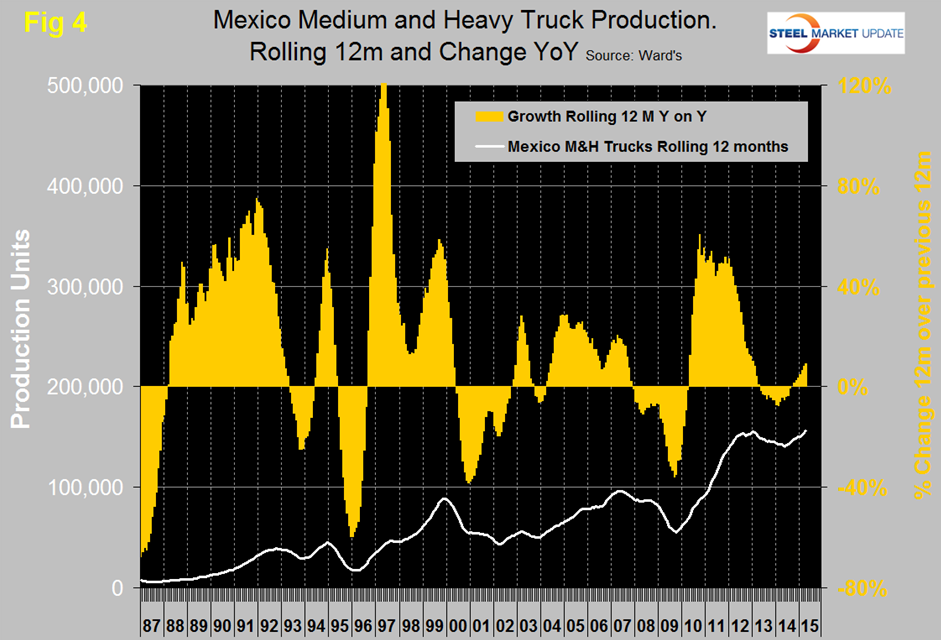
Note that to achieve true comparability the scales are the same. It can be seen that the growth rate in Canada has been relatively strong in the last few months but this is from a very low base and evidently the truck assemblers have made the decision to move their operations south. There has been a major shift in M&HT production share between the three NAFTA countries in the last four years. Figure 5 shows the production share of each country since 1987.
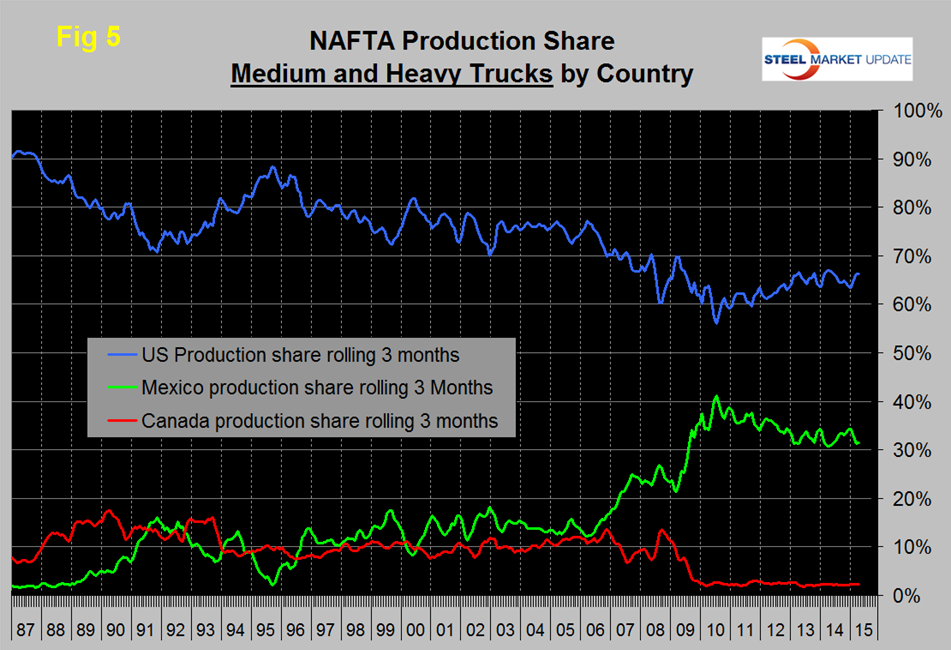
Between 2006 and mid-2010 Mexico took share from the US and virtually ran Canada out of the business. In Mid-2010 the growth patterns of the US and Mexico reversed and the US picked up share until mid-2014. Since then Mexico and the US have been holding their own. Close examination of Fig 5 shows that over the short run the changes between the US and Mexico are mirror images of each other. When one goes down the other goes up, meaning that the auto companies are routinely shifting production presumably because of local short term considerations. Our understanding of vehicle manufacturing shifts within NAFTA is complicated by the cross border transfer of components and sub-assemblies. The only data we have is for the point at which the finished vehicle rolls off the line.
Sales of M&HT in the US in 2015 are projected to be about 250,000 units with a year over year growth rate in the region of 20 percent. US production will be about 320,000 units in 2015 meaning that the US has a healthy trade surplus in this product.


