Market Data

July 27, 2015
The Chicago Federal Reserve National Activity Index and Steel Supply
Written by Peter Wright
The following is the Chicago Federal Reserve statement followed by our own graphical analysis. The CFNAI is an excellent reality check for much of the economic analysis that we routinely provide in at Steel Market Update and is also a reasonably good predictor of steel demand with a six to nine month lead. For example by the time the steel market went off the cliff in September 2008, the CFNAI had been signaling an increasingly severe problem for eight months. An explanation of the Index is provided at the end of this piece.
![]() Index shows economic growth picked up slightly in June
Index shows economic growth picked up slightly in June
Led by improvements in production- and employment-related indicators, the Chicago Fed National Activity Index (CFNAI) moved up to +0.08 in June from –0.08 in May. Three of the four broad categories of indicators that make up the index increased from May, and two of the four categories made positive contributions to the index in June.
The index’s three-month moving average, CFNAI-MA3, edged up to –0.01 in June from –0.07 in May. June’s CFNAI-MA3 suggests that growth in national economic activity was very close to its historical trend. The economic growth reflected in this level of the CFNAI-MA3 suggests limited inflationary pressure from economic activity over the coming year.
The CFNAI Diffusion Index, which is also a three-month moving average, moved up to +0.07 in June from –0.01 in May. Forty-eight of the 85 individual indicators made positive contributions to the CFNAI in June, while 37 made negative contributions. Forty-four indicators improved from May to June, while 40 indicators deteriorated and one was unchanged. Of the indicators that improved, 13 made negative contributions.
Figure 1 shows our analysis of the 3MMA of the CFNAI through June.
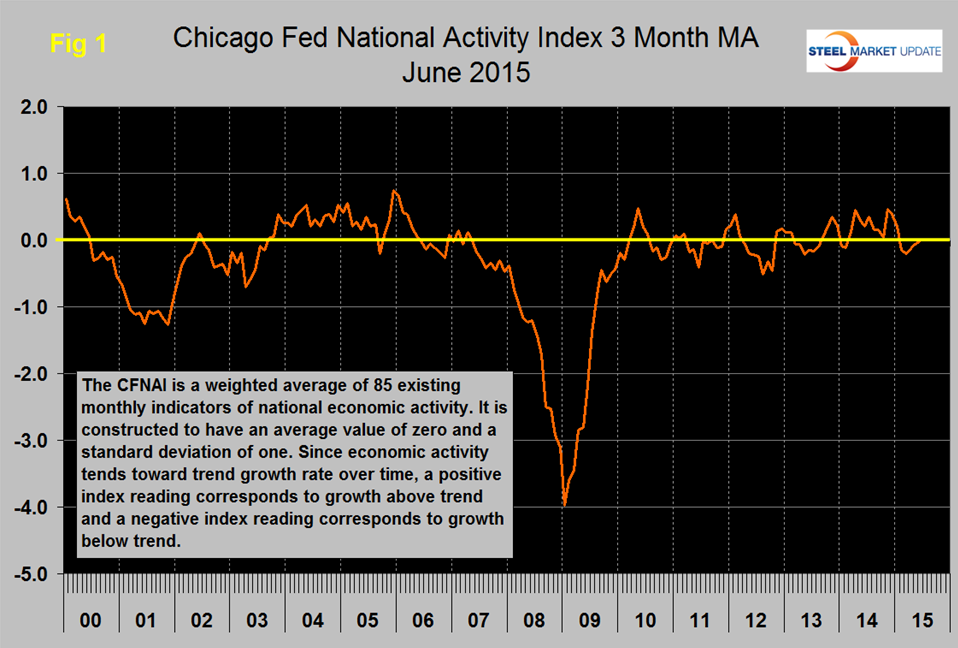
There was an erratic though sustained improvement from mid-2012 to November last year but in the next four months through March the index declined. In April May and June the index steadily improved and in June achieved a positive reading of +0.08. The 3MMA which we plot in Figure 1 came in at -0.01 in June meaning that the economy is expanding at almost exactly its historical trend which is represented by the zero line (see explanation below). Figure 2 shows the trends of the four main sub-components.
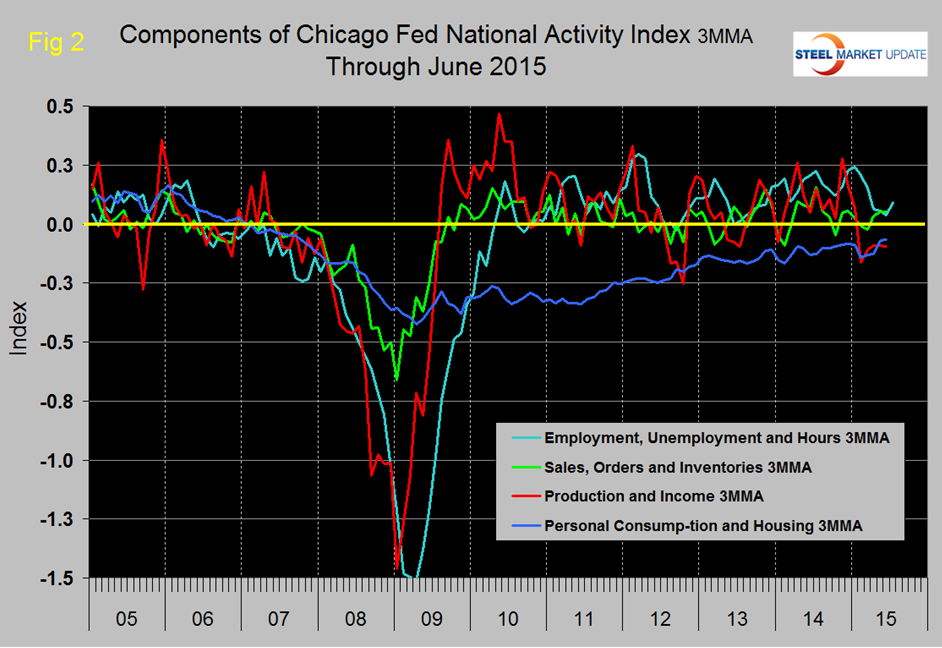
The sub-component “Employment” had the best performance in June, production and income declined very slightly, personal consumption and sales were flat.
Figure 3 shows that the CFNAI has historically been a reasonably accurate leading indicator of steel demand (apparent supply) with a lead time of six to nine months.
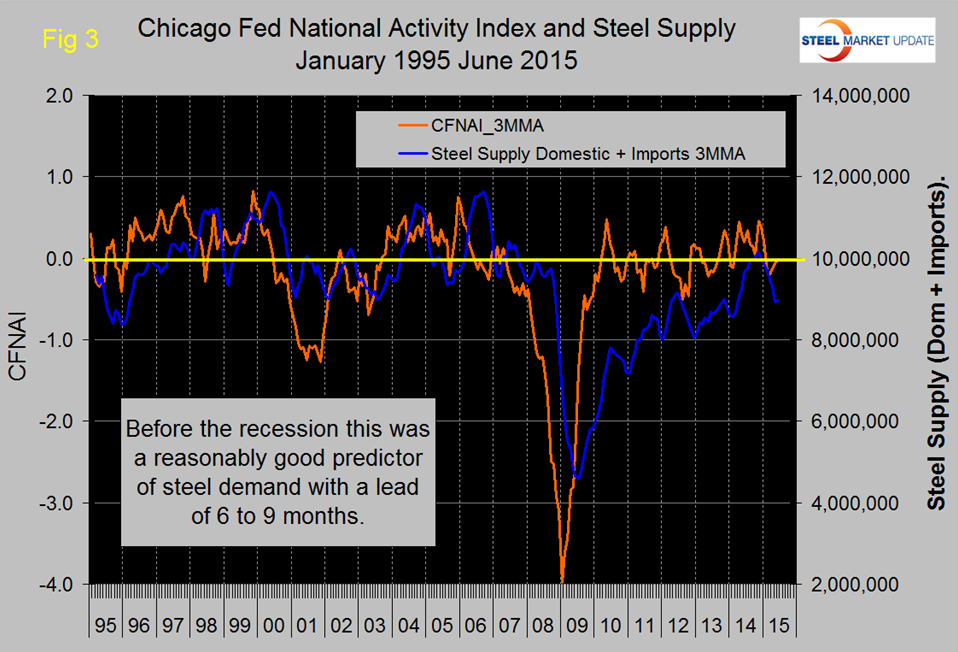
SMU monitors several benchmark indicators to evaluate whether steel consumption is where it should be based on historical patterns. Total steel supply was closing the gap but in the last two months has fallen off again. Figure 4 and Figure 5 show this same relationship for flat rolled and long products separately and the difference is quite dramatic and in agreement with our analysis of steel service center shipments.
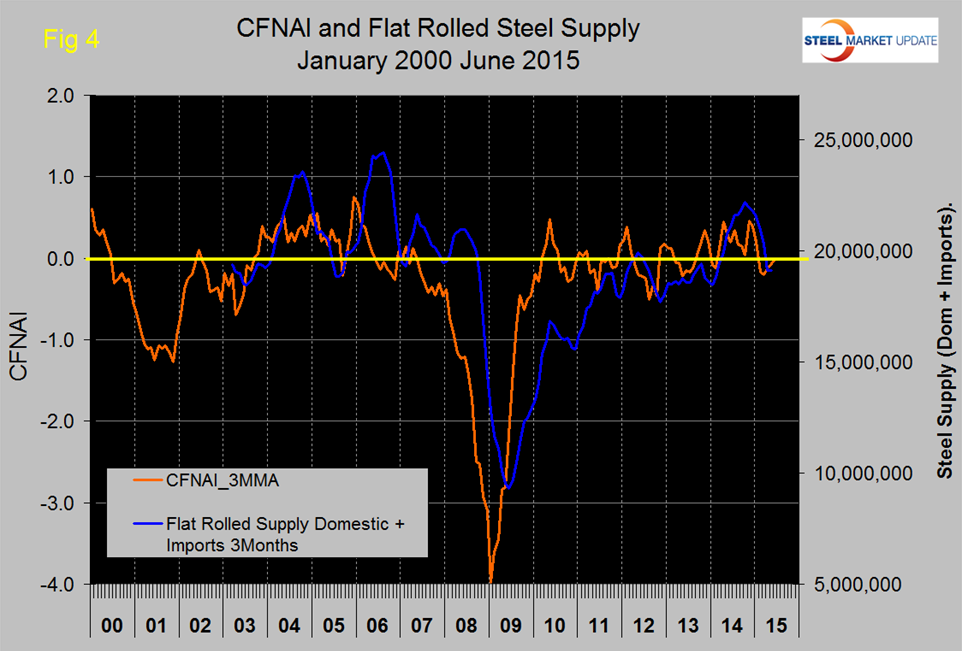
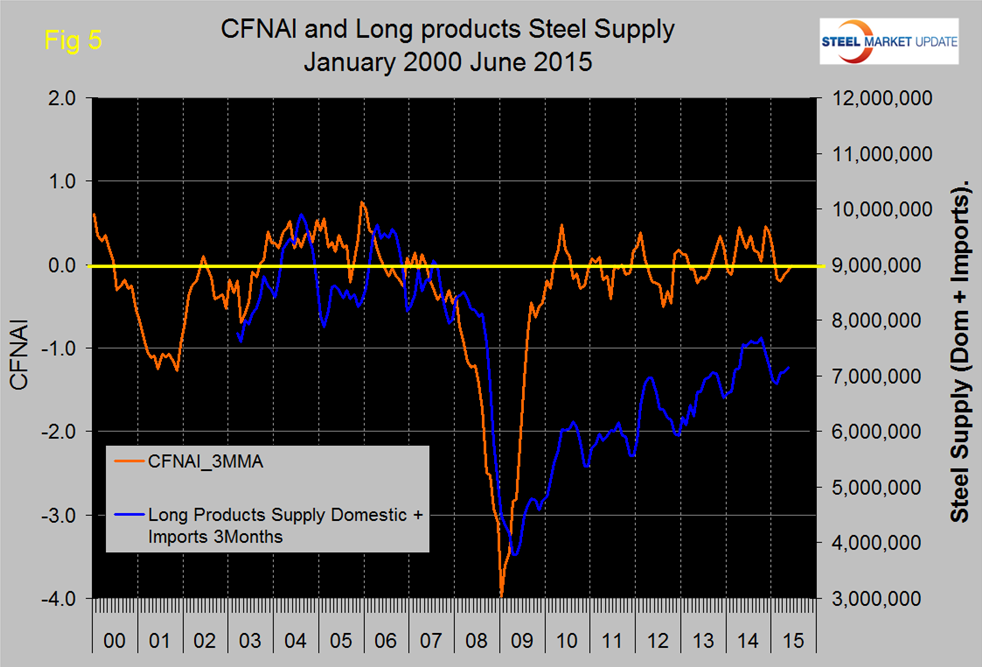
The gap closure has been entirely driven by flat rolled with long products still trailing badly. Based on the historical lead of the CFNAI it looks as though total steel demand will pick up slightly in the third quarter.
Explanation: The index is a weighted average of 85 indicators of national economic activity drawn from four broad categories of data: 1) production and income; 2) employment, unemployment, and hours; 3) personal consumption and housing; and 4) sales, orders, and inventories. A zero value for the index indicates that the national economy is expanding at its historical trend rate of growth; negative values indicate below-average growth; and positive values indicate above-average growth. When the CFNAI-MA3, (three month moving average) value moves below –0.70 following a period of economic expansion, there is an increasing likelihood that a recession has begun. Conversely, when the CFNAI-MA3 value moves above –0.70 following a period of economic contraction, there is an increasing likelihood that a recession has ended. When the CFNAI-MA3 value moves above /+0.70 more than two years into an economic expansion, there is an increasing likelihood that a period of sustained increasing inflation has begun.