Analysis

August 17, 2015
Housing Starts, Permits and Builder Confidence
Written by Peter Wright
Sales of new single-family houses in June 2015 were at a seasonally adjusted annual rate of 482,000, according to estimates released jointly by the U.S. Census Bureau and the Department of Housing and Urban Development. This is 6.8 percent below the revised May rate of 517,000, but is 18.1 percent above the June 2014 estimate of 408,000.
The median sales price of new houses sold in June 2015 was $281,800; the average sales price was $328,700. The seasonally adjusted estimate of new houses for sale at the end of June was 215,000. This represents a supply of 5.4 months at the current sales rate.
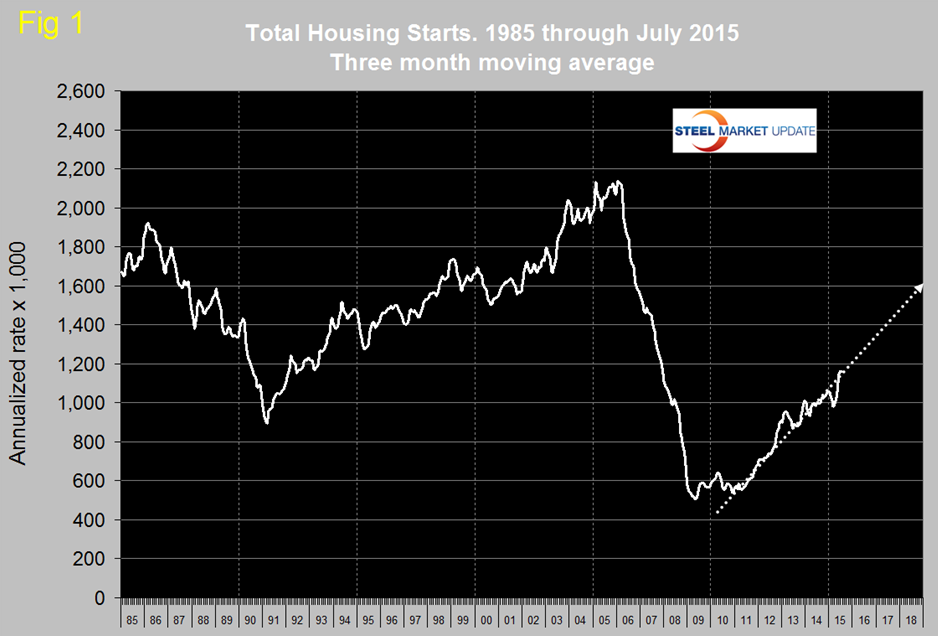
Total housing starts in June were at an annual rate of 1,204 ,000 which was the best since October 2007, July improved on June with a rate of 1,206,000 which yielded a three month moving average (3MMA) of 1,161,000. Total starts are on track to reach 1.6 million units annualized by the end of 2018. The 3MMA was the best result since February 2008 (Figure 1).
On that basis, single family at 724,000 was up by 2.2 percent month over month and up by 14.9 percent year over year but is still 57.1 percent below the peak of late 2005. This was the best y/y growth rate of single family since August 2013. Multifamily (apartments/condominiums) was down by 1.8 percent m/m and up by 19.5 y/y. The Census Department results are seasonally adjusted and the monthly numbers are annualized.
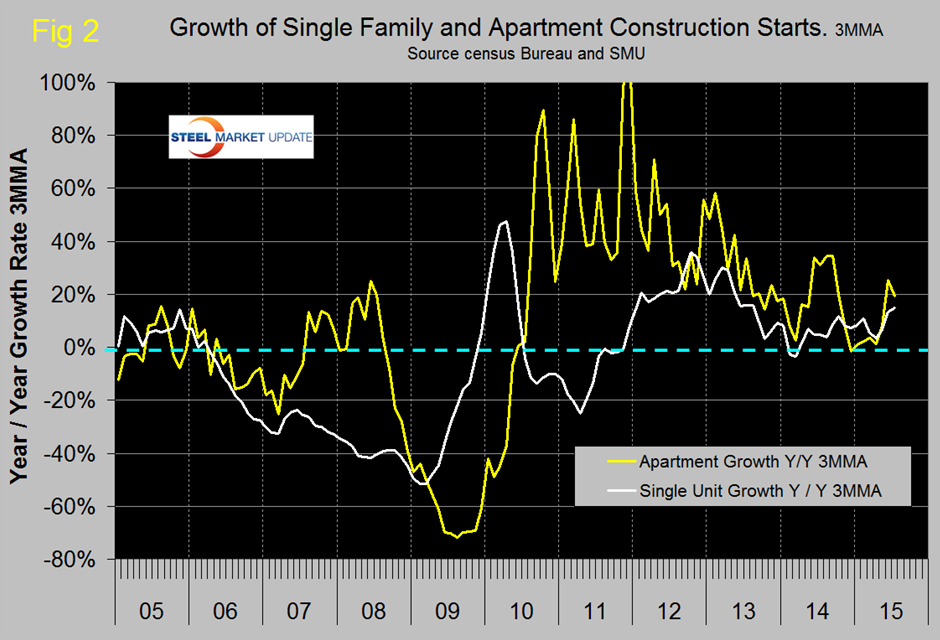
Multifamily starts had lack-luster growth for seven months prior to June but the last two months have returned to the level not seen since October last year, driven strongly by apartment construction in New York (Figure 2).
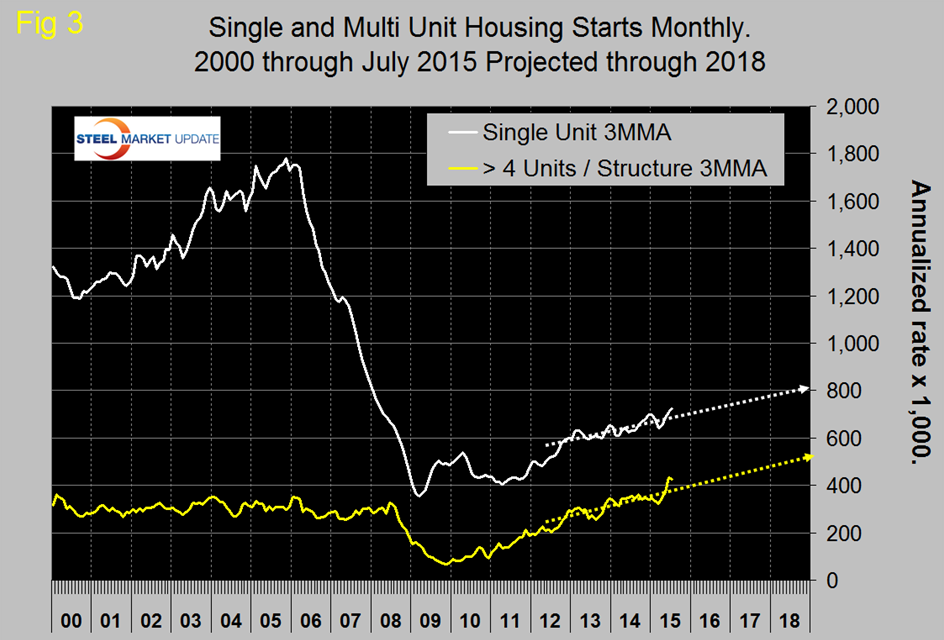
The trajectory of single family and apartments >4 units are tracking to reach 800,000 and 500,000 by the end of 2018 respectively (Figure 3).
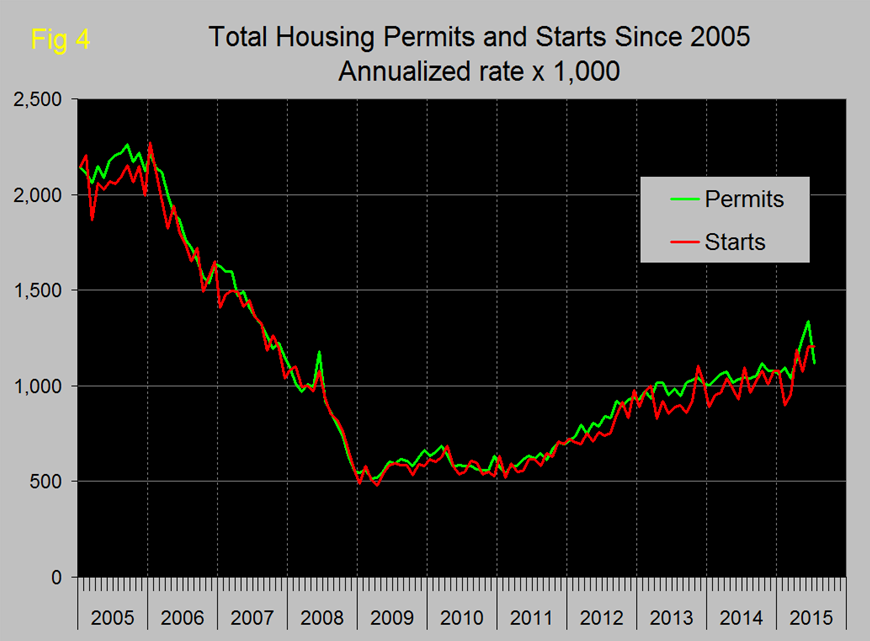
Permit data is useful as a forward look at starts. If permits exceed starts then we anticipate an acceleration in construction and vice versa. Total permits in June were the highest since mid-2007 at 1,337,000 and were way higher than the trend line. In July permits declined to 1,119,000 which was exactly back in line with the 30 month trend line (Figure 4).
On a 3MMA basis total permits were up by 19.9 percent y/y. Single family were up by 7.2 percent and multifamily by 40.5 percent. Multifamily continued to be strongly influenced by activity in New York.
Table 1 shows total permits and starts nationally and regionally.
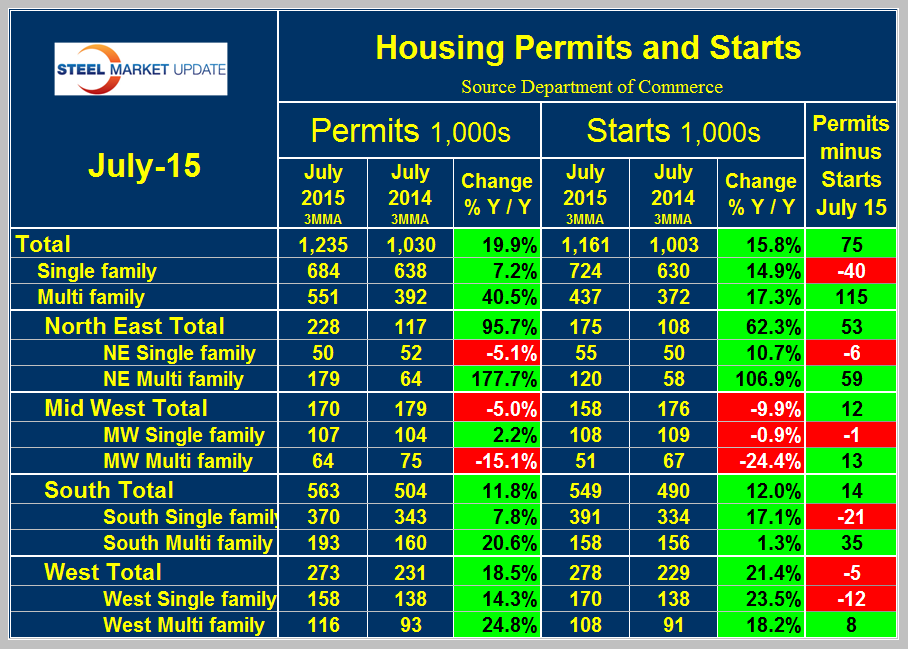
At the national level the differential between permits and starts for single and multi-family units is suggesting that the shift in consumer’s preference towards apartments is far from over. In July on a 3MMA basis, permits of multi-family exceeded starts by 115,000 in contrast to the negative 40,000 for single family. In total permits were 75,000 more than starts. The differential between permits and starts for multi and single family units was the same across all regions with permits for multifamily exceeding starts and permits for single family being less than starts. The implication is that apartment construction is poised to surge strongly and that single family construction will slow slightly. The ratio of the two sectors is shown in Figure 5 and demonstrates that single family homes continue to be less desirable than at any time since March 1974. Based on permit data the ratio will not change any time soon.
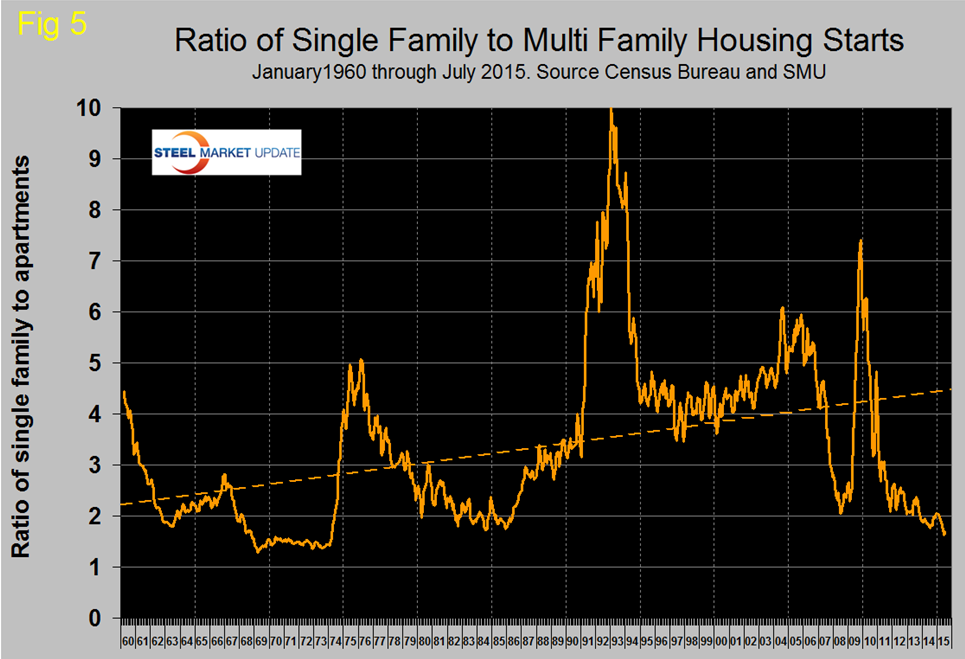
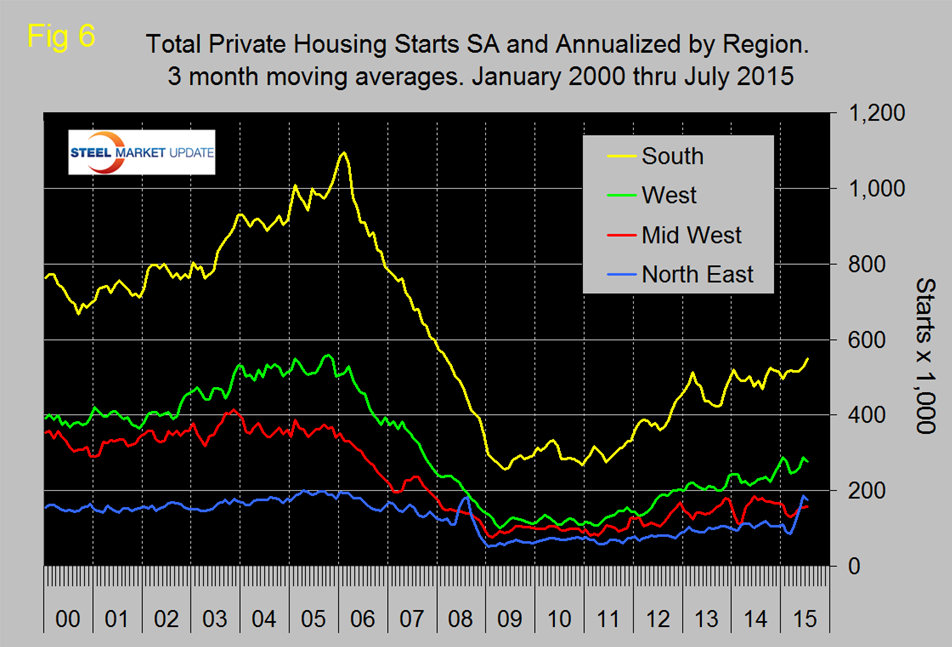
Figure 6 shows the regional situation for the 3MMA of total residential starts since February 2000. In 2015 the Northeast has the highest growth rate driven we believe by apartment construction in New York.
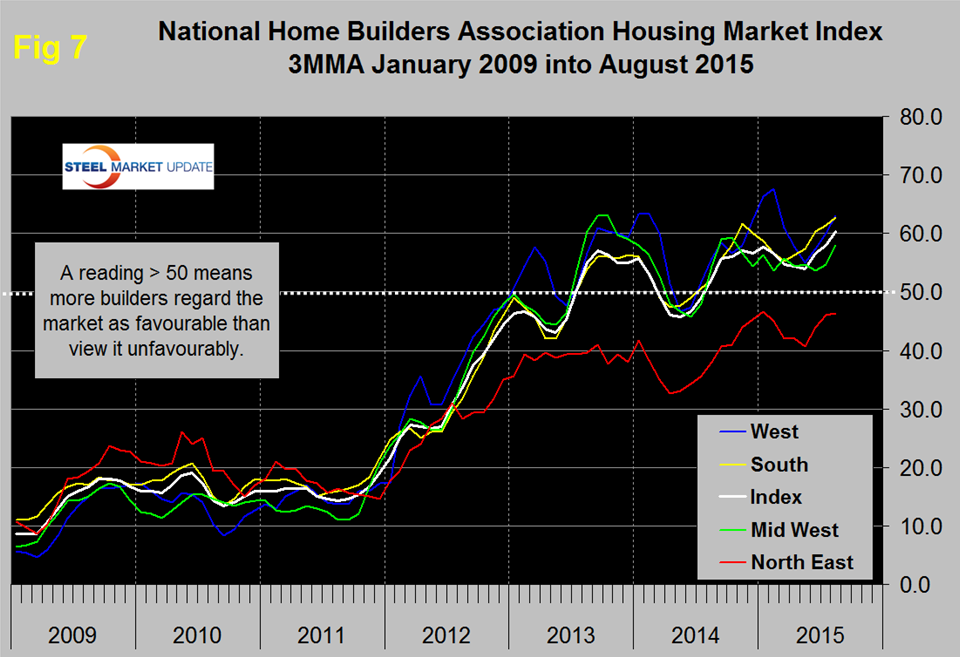
The National Association of Home Builders (NAHB) confidence report was released on Monday. Any value above 50 indicates an overall positive business confidence. The national average gained one point to 61 with a 3MMA of 60.3 which is the highest value since our data stream began in January 2009. All regions enjoyed an increase in confidence on a three month moving average basis (Figure 7). The South and west continue to be the strongest regions.
The official release from the NAHB was as follows:
Builder Confidence Rises One Point in August
Builder confidence in the market for newly built, single-family homes in August rose one point to a level of 61 on the National Association of Home Builders/Wells Fargo Housing Market Index (HMI). This is the highest reading since November 2005.
“The fact the builder confidence has been in the low 60s for three straight months shows that single-family housing is making slow but steady progress,” said NAHB Chairman Tom Woods, a home builder from Blue Springs, Mo. “However, we continue to hear that builders face difficulties accessing land and labor.”
“Today’s report is consistent with our forecast for a gradual strengthening of the single-family housing sector in 2015,” said NAHB Chief Economist David Crowe. “Job and economic gains should keep the market moving forward at a modest pace throughout the rest of the year.”
Derived from a monthly survey that NAHB has been conducting for 30 years, the NAHB/Wells Fargo Housing Market Index gauges builder perceptions of current single-family home sales and sales expectations for the next six months as “good,” “fair” or “poor.” The survey also asks builders to rate traffic of prospective buyers as “high to very high,” “average” or “low to very low.” Scores for each component are then used to calculate a seasonally adjusted index where any number over 50 indicates that more builders view conditions as good than poor.
Two of the three HMI components posted gains in August. The index measuring buyer traffic increased two points to 45 and the component gauging current sales conditions rose one point to 66. Meanwhile, the index charting sales expectations in the next six months held steady at 70.
Looking at the three-month moving averages for regional HMI scores, the West and Midwest each rose three points to 63 and 58, respectively. The South posted a two-point gain to 63 and the Northeast held steady at 46.
Editor’s Note: The NAHB/Wells Fargo Housing Market Index is strictly the product of NAHB Economics, and is not seen or influenced by any outside party prior to being released to the public.