Market Data

February 17, 2016
ABI Starts Year with a Decline
Written by Sandy Williams
After a generally positive performance in 2015, the Architectural Billings Index started the year with a slip to 49.6 in January from December’s reading of 51.3. A score above 50 indicates growth in design services and below 50 indicates a decline.
AIA Chief Economist Kermit Baker called January “rocky” but noted “the fundamentals are mostly sound in the nonresidential design and construction market.” Falling stock and oil prices along with an increase in global concerns may have played a role in the January decline, said Baker.
The new projects inquiry index was 55.3 in January, down from 60.5 in December. The design contracts index registered 50.9.
The regional and sector breakdowns were as follows:
Regional averages: West (50.8), Northeast (50.4), South (50.3), Midwest (48.9),
Sector index breakdown: multi-family residential (51.9), commercial / industrial (50.5), institutional (49.9), mixed practice (49.0)
About the AIA Architecture Billings Index
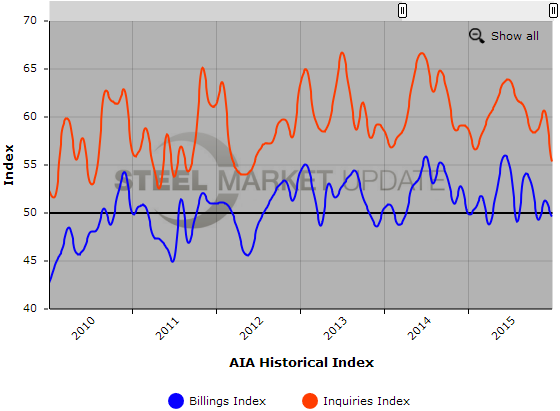
The Architecture Billings Index (ABI), produced by the AIA Economics & Market Research Group, is a leading economic indicator that provides an approximately nine to twelve month glimpse into the future of nonresidential construction spending activity. The diffusion indexes contained in the full report are derived from a monthly “Work-on-the-Boards” survey that is sent to a panel of AIA member-owned firms. Participants are asked whether their billings increased, decreased, or stayed the same in the month that just ended as compared to the prior month, and the results are then compiled into the ABI. These monthly results are also seasonally adjusted to allow for comparison to prior months. The monthly ABI index scores are centered around 50, with scores above 50 indicating an aggregate increase in billings, and scores below 50 indicating a decline. The regional and sector data are formulated using a three-month moving average.
Below is a graph showing the history of the Architecture Billings Index and Inquiries Index. You will need to view the graph on our website to use it’s interactive features, you can do so by clicking here. If you need assistance with either logging in or navigating the website, please contact our office at 800-432-3475 or info@SteelMarketUpdate.com.