Analysis

February 23, 2016
US Vehicle Sales and NAFTA Vehicle Production in January 2016
Written by Peter Wright
US vehicle sales in January exceeded expectations and came in at 17.6 million units on a seasonally adjusted annual rate basis. This was up by 300,000 from December and by 5.4 percent year over year. Light truck sales contributed 10.1 million units and autos 7.4 million.
![]() This month we decided to examine the long term trend of auto and light truck sales. This is a work in progress as we intend to push the data back to January 2006, before the recession. However the recent changes beginning in early 2014 are so dramatic that we thought we would jump the gun and publish what we have so far. Figure 1 shows auto and light truck sales from October 2010 through January this year.
This month we decided to examine the long term trend of auto and light truck sales. This is a work in progress as we intend to push the data back to January 2006, before the recession. However the recent changes beginning in early 2014 are so dramatic that we thought we would jump the gun and publish what we have so far. Figure 1 shows auto and light truck sales from October 2010 through January this year.
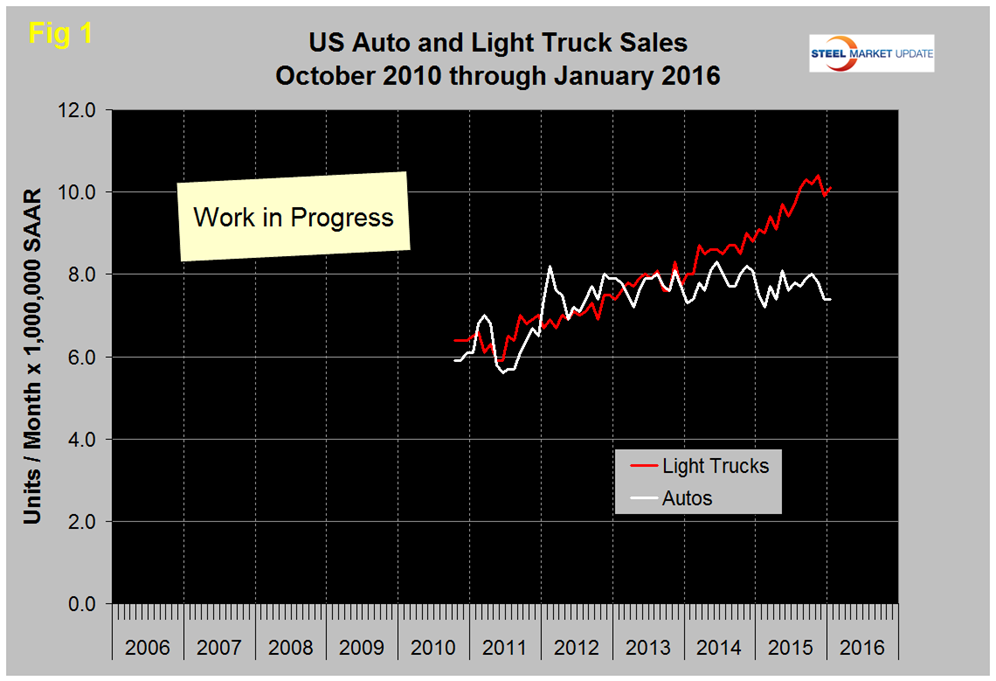
Auto sales have been essentially flat for four full years as all the growth has occurred in light trucks which include crossovers. Improved unit fuel consumption and low gasoline prices are no doubt two of the major drivers of this change.
Total light vehicle (LV) production in NAFTA in January was at an annual rate of 16.137 million units, up from 14.719 million in December. Total production in 2015 was 17.361 million units. In cases where seasonality is more than a weather effect we like to compare the monthly result with the monthly norm over a number of years. On average since 2004, January’s production has been 12.2 percent more than December. This year January was 9.6 percent more than December (Figure 2).
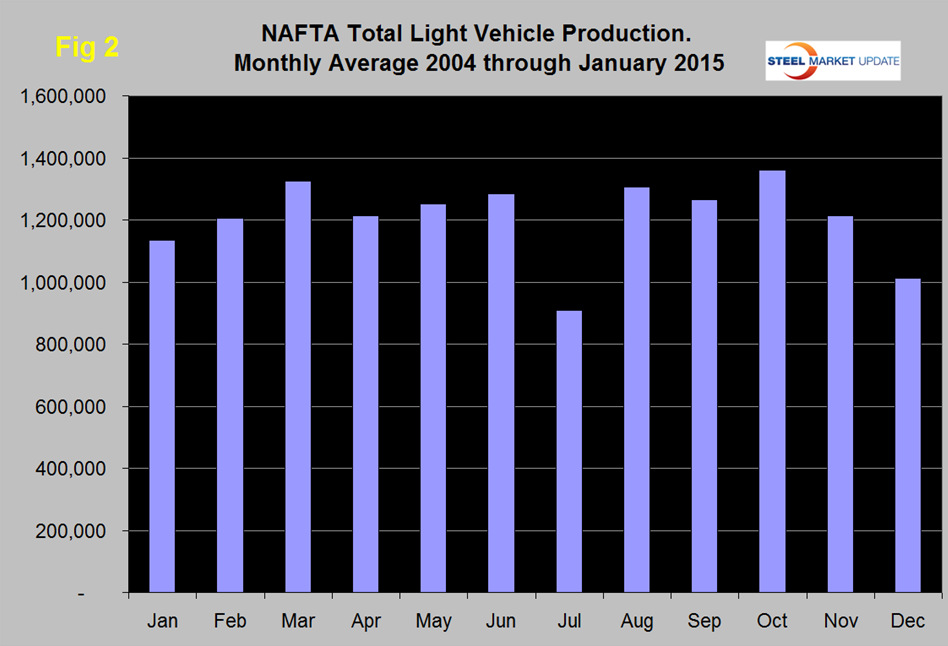
Note that these production numbers are not seasonally adjusted, the sales data reported above are seasonally adjusted. On a three month moving average basis (3MMA) January production was up by 2.6 percent year over year. January production was the highest for that month since January 2003. History tells us that we can expect assemblies to continue to expand in February and March.
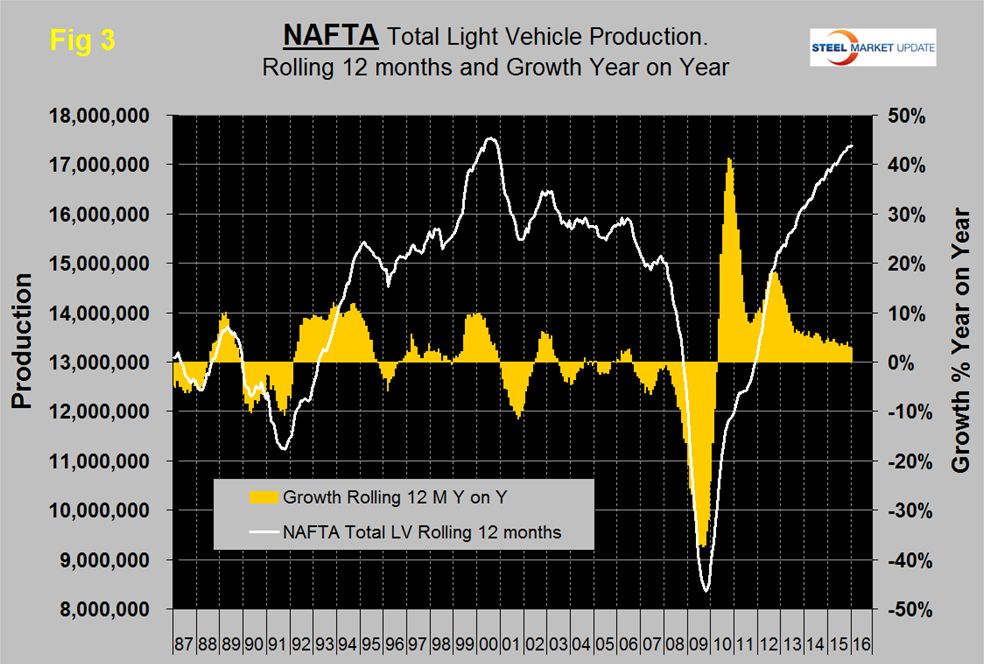
On a rolling 12 months basis y/y through January, LV production in NAFTA increased by 2.6 percent which was the same as 12 months through December. LV production in NAFTA is now well above the pre-recession peak of Q2 2006 and is heading for the all-time high of mid-2000 (Figure 3).
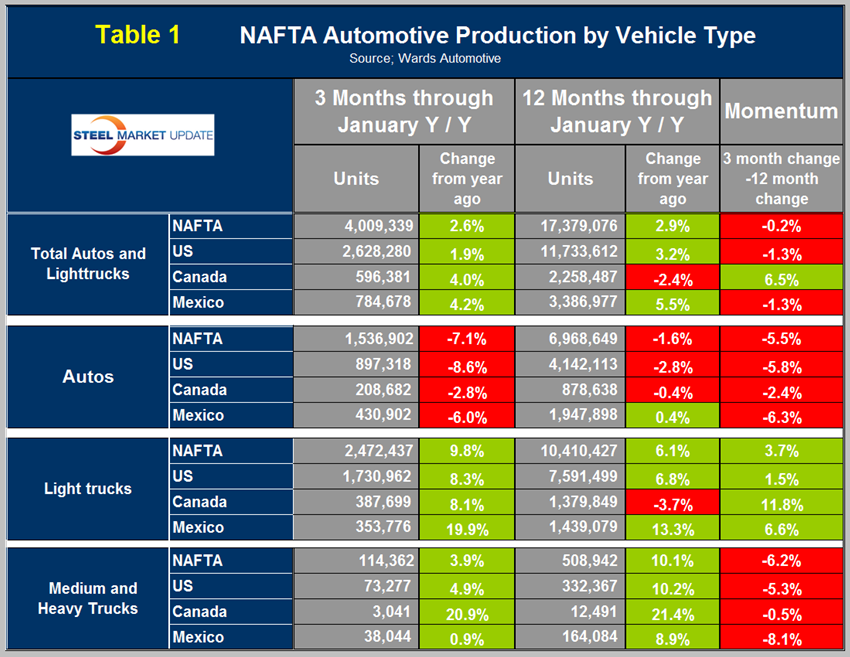
On a rolling 12 months basis y/y the US is up by 3.2 percent with slightly negative momentum, Canada is down by 2.4 percent with positive momentum and Mexico is up by 5.5 percent with negative momentum (Table 1).
Mexico has had negative momentum for nine straight months and in ten of the last eleven months. The US has gained production share in the most recent 3.5 years (Figure 4) at the expense of Canada though that trend has slowed.
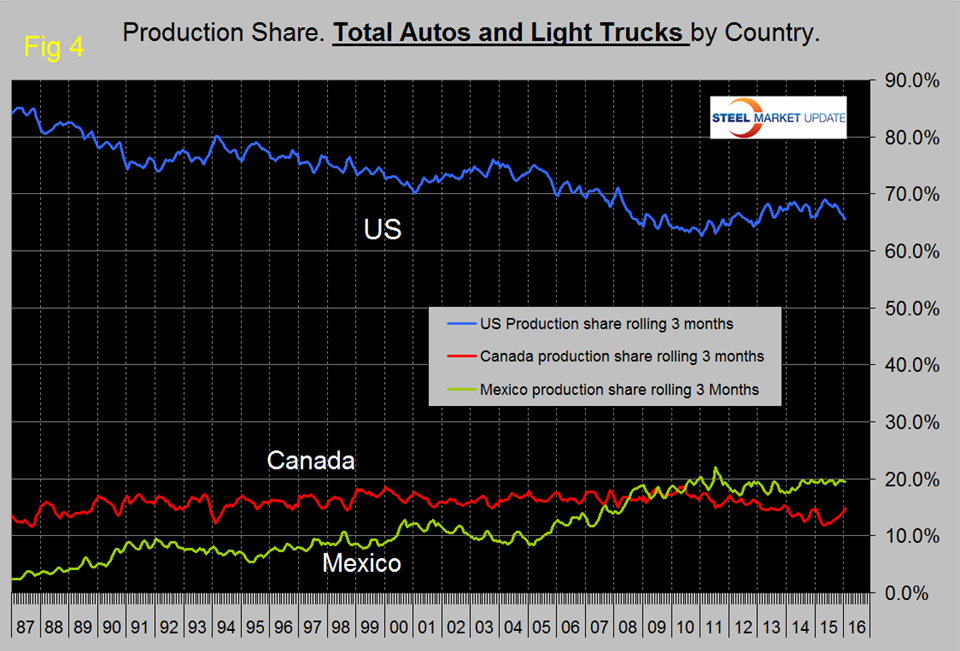
Mexico’s share has been fairly flat for five years and extremely flat for the last 18 months. In January on a rolling three month basis, the US production share of total light vehicles was 65.6 percent, Canada’s was 14.9 percent and Mexico’s was 19.6 percent.
Figure 5, Figure 6 and Figure 7 show total LV production by country with y/y growth rates and on each the red line shows the change in production since Q2 2006.
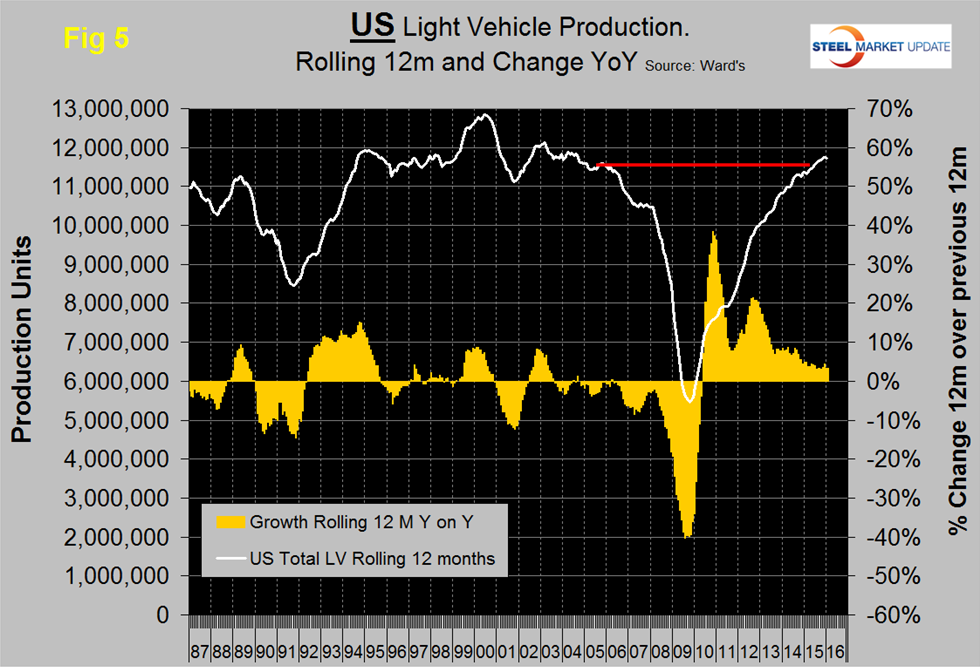
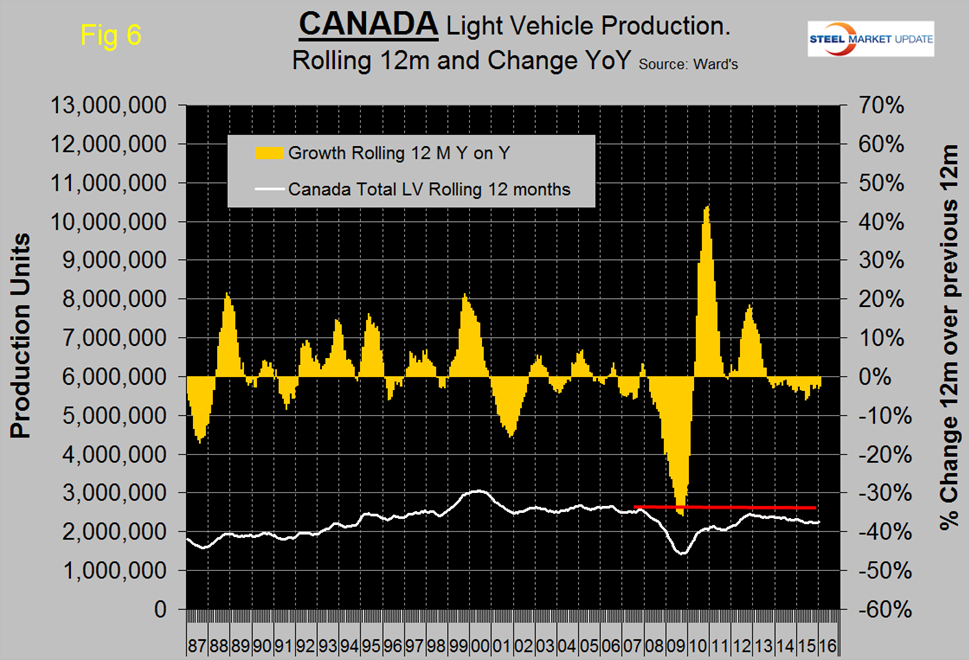
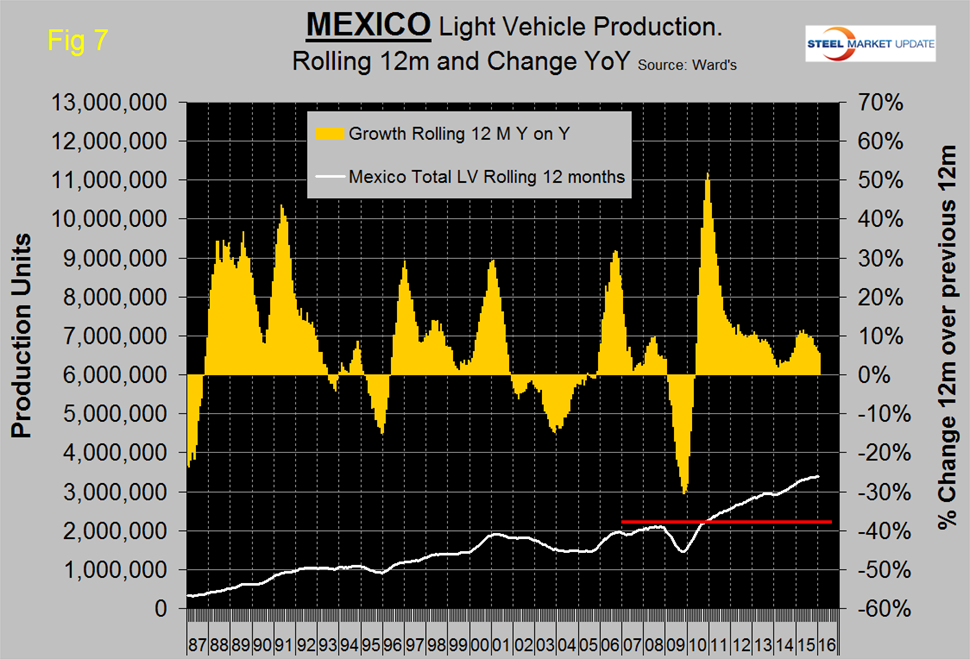
Note the scales are the same to give true comparability and that Mexican growth has slowed significantly this year but is still higher than in the US. Canada continues to contract. During the recession Mexico declined by less than the US and bounced back by more during the recovery. This caused Mexico’s production share to surge until Mid-2011 at the expense of the US.
The percentage of Autos in the production mix of all three countries is down this year, meaning that light trucks are up. The change for NAFTA as a whole is very significant and is being driven by consumer buying preferences as described above. In three months through January year over year, auto production was down by 7.1 percent and light trucks were up by 9.8 percent. This tends to favor the US and Canada over Mexico because the mix of light vehicles is very different by country (Figure 8).
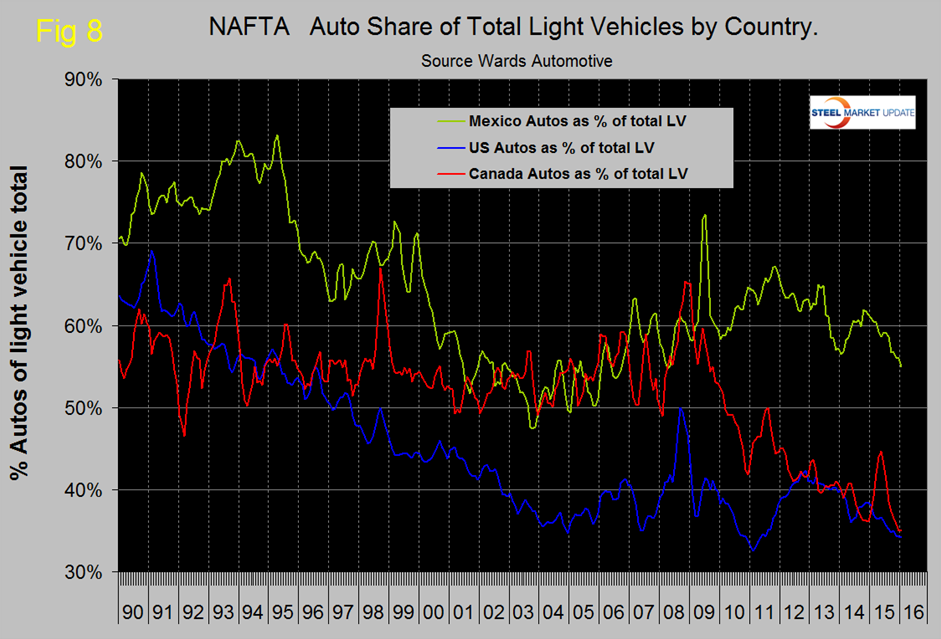
The percentage of autos in the Mexican mix in the last three months was 54.9 percent but only 34.1 in the US and 35.0 percent in Canada. This means that Mexico has staked out a higher relative capacity in autos which will serve it well when gas prices eventually rebound. The light truck component of the US light vehicle mix has been increasing for over three years and in Canada for six years.
Ward’s Automotive reported this week that total light vehicle inventories in the US increased by 17 days of sales in January from 61 days at the end of December to 78 days at the end of January, but down by 3 days from January last year. Month over month FCA (Fiat Chrysler Automotive) was up by 21 days to 103, Ford was up by 21 days to 100 and GM up by 13 to 74 days.
The SMU data file contains more detail than be shown here in this condensed report. Readers can obtain copies of additional time based performance results on request if they wish to dig deeper. Available are graphs of auto, light truck and medium and heavy truck production and growth rate and production share by country.