Market Data

March 1, 2016
Chicago Business Barometer Tumbled in February
Written by Sandy Williams
The Chicago Business Barometer surprised economists with an 8 point tumble to 47.6 in February after increasing to 55.6 in January. Sharp declines in production in new orders contributed to the weaker readings. Economists expected a milder decline to 53; a reading below 50 indicates a contraction in business activity.
As new orders dropped sharply, production plunged 18.5 points, more than reversing January’s 16 point gain. Backlogs slipped further into contraction.
The employment index was at its lowest level since November 2009 and fifth consecutive month in contraction.
Firms continued to reduce inventories in February, with the index for inventories in contraction for the fourth month in a row.
The prices paid index contracted faster in February and were at its lowest level since July 2009.
In a special question put to the panel this month, 48 percent said that lower oil prices were helping business, mainly due to lower freight and transportation costs. 26 percent of respondents said that lower oil prices were hurting business, while 26 percent said they had little or no impact on their business.
Chief Economist of MNI Indicators Philip Uglow said, “If one looks beyond the gyrations seen over the past three months then trend activity has been running a little below the 50 neutral mark, highlighting continued sluggish activity levels, with manufacturers under particular pressure. Still, given the weakness in Q4, it looks like activity should pick up during Q1.”
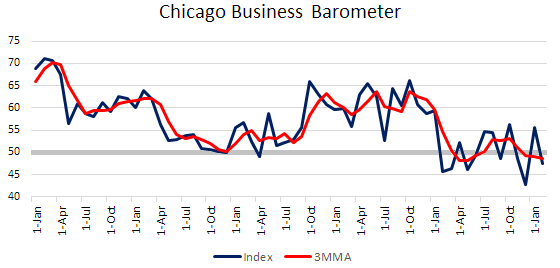
Because of the volatility of index readings for the Chicago Business Barometer, we are presenting the index in comparison to the three month moving average so that a clearer trendline for the index can be identified. As you can see, despite the many peaks and valleys in 2015-2016, the 3mma line has been relatively flat through most of 2015, hovering above and below the neutral 50 point. Third quarter saw a lift in activity but business activity has been on a gradual decline since November.
Below is a graph showing the history of the Chicago Business Barometer. You will need to view the graph on our website to use it’s interactive features, you can do so by clicking here. If you need assistance with either logging in or navigating the website, please contact our office at 800-432-3475 or info@SteelMarketUpdate.com.