

Market Data

March 10, 2016
US Gross Domestic Product by Region and by State
Written by Peter Wright
The Bureau of Economic Analysis (BEA) has now got their date base for the GDP of each state up and running and last week published data from Q1 2005 through Q3 2015. Looking ahead the data will be published quarterly and is reported in chained 2009 dollars seasonally adjusted. We at SMU plan to analyze the data and report to our subscribers quarterly by region. Should anyone wish to see data and graphs for an individual state then we will supply on a one off basis.
Table 1 show the growth of regional GDP in chained 2009 dollars quarter on quarter (these numbers are not annualized as is the case for published reports of the growth of national GDP.)
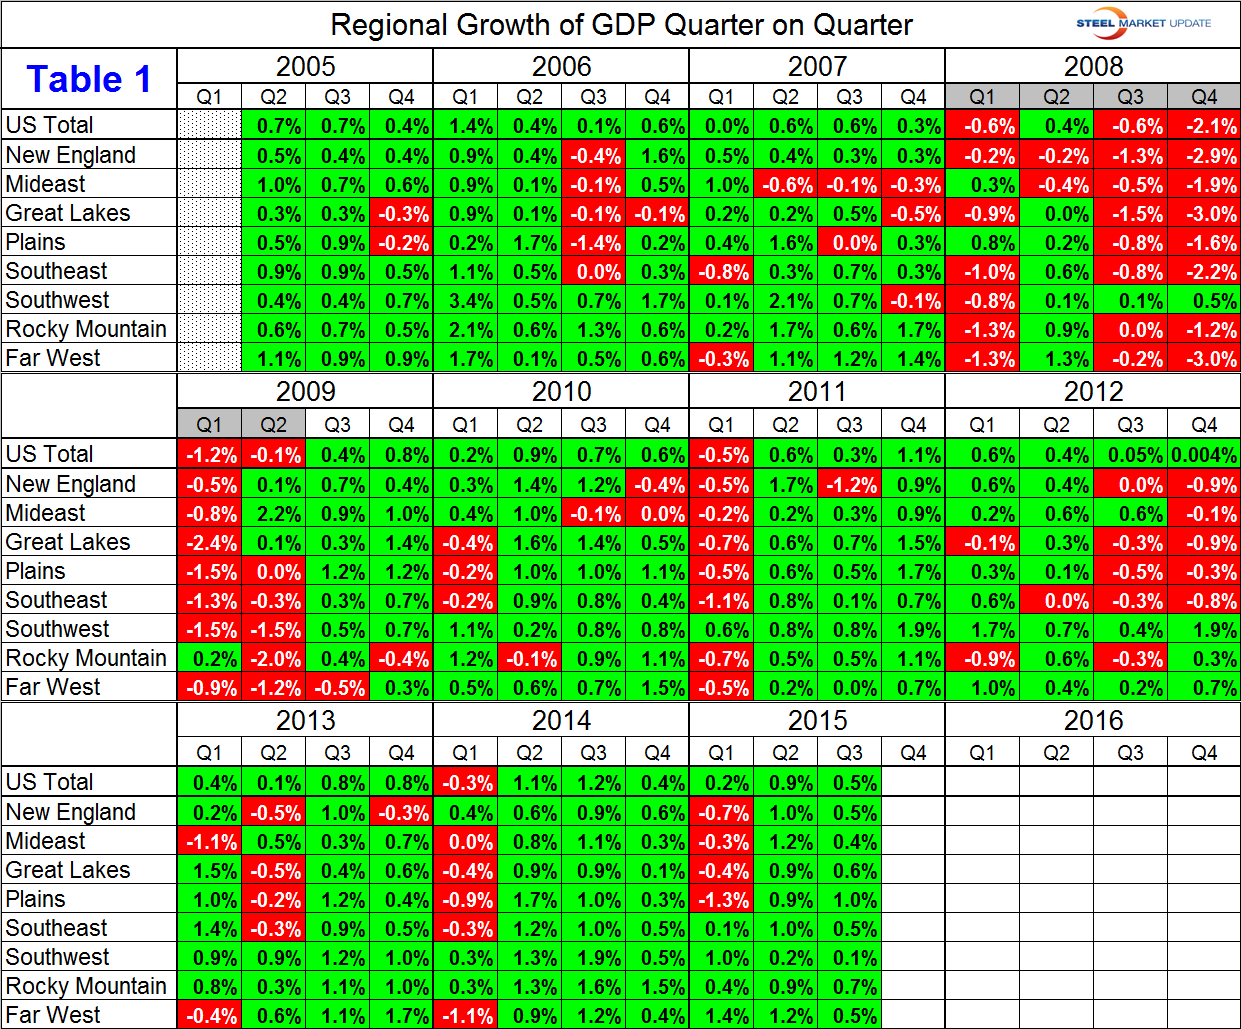
Our first impression of this data is that it is spottier than we expected. Some points to note are that naturally the great recession is very obvious, the definition of a recession is two or more quarters back to back with negative growth. The winter effect in the northern regions also stands out. Four regions were in recession in the second half of 2012, a situation that we don’t recall ever seeing reported. The South West region flipped from the highest growth rate in Q1 2015 to the lowest in Q2 and Q3 of that year. Clearly an energy effect. In the third quarter the Plains states had the highest growth rate followed by the Rocky Mountain region.
Regions as defined by the BEA are as follows:
New England: Connecticut, Maine, Massachusetts, New Hampshire, Rhode Island, Vermont.
Mideast: Delaware, DC, Maryland, New jersey, New York, Pennsylvania.
Great Lakes: Illinois, Indiana, Michigan, Ohio, Wisconsin.
Plains: Iowa, Kansas, Minnesota, Missouri, Nebraska, North Dakota, South Dakota.
South East: Alabama, Arkansas, Florida, Georgia, Kentucky, Louisiana, Mississippi, North Carolina, South Carolina, Tennessee, Virginia, West Virginia.
South West: Arizona, New Mexico, Oklahoma, Texas
Rocky Mountains: Colorado, Idaho, Montana, Utah, Wyoming.
Far West: Alaska, California, Hawaii, Nevada, Oregon, Washington.
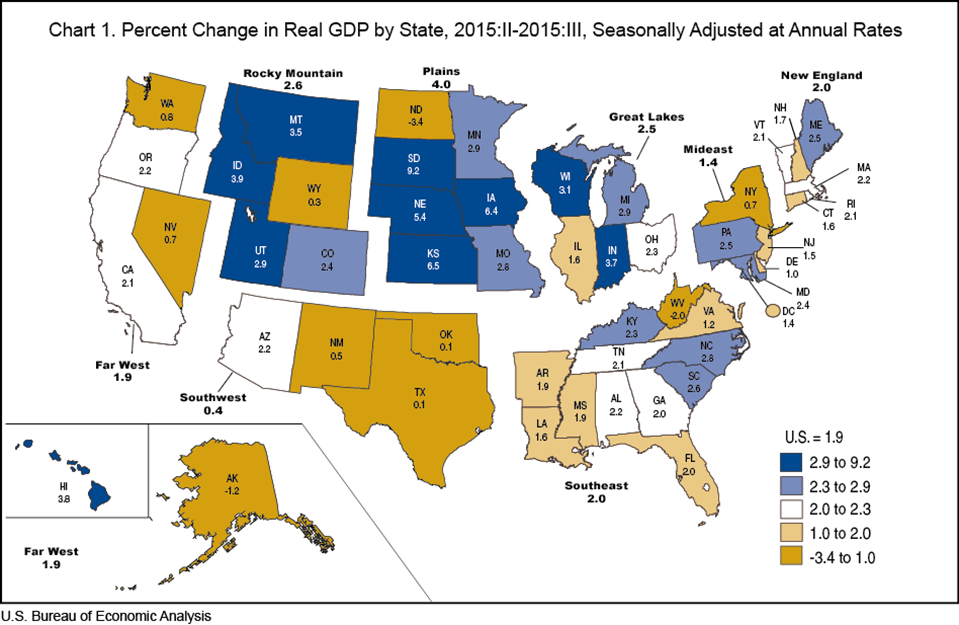
The BEA produces a map of the United States showing Q/Q growth by state within each region which we have reproduced here as Figure 1.
Once a quarter at SMU we publish a regional job creation report from data produced by the Bureau of Labor Statistics. Unfortunately, the regions of the BLS report aren’t defined quite the same as is the case with the BEA data for GDP. In future we will probably re-organize the BEA data on GDP so it coincides with the BLS data for job creation. The point is that we are trying to produce uniform information so our subscribers can compare their own corporate results with those of their region to establish whether their business is swimming up or down stream.
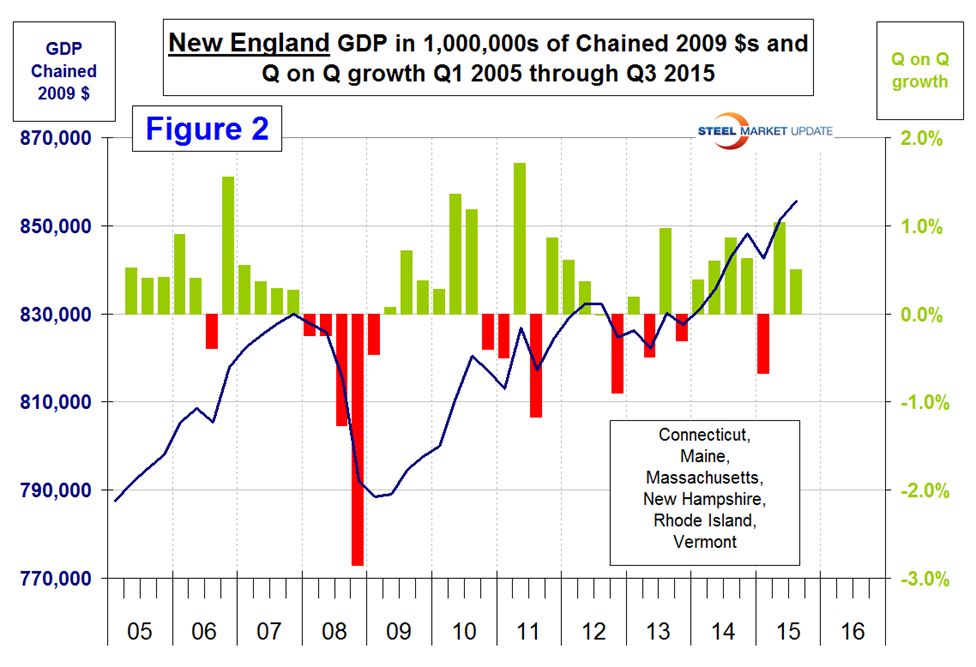
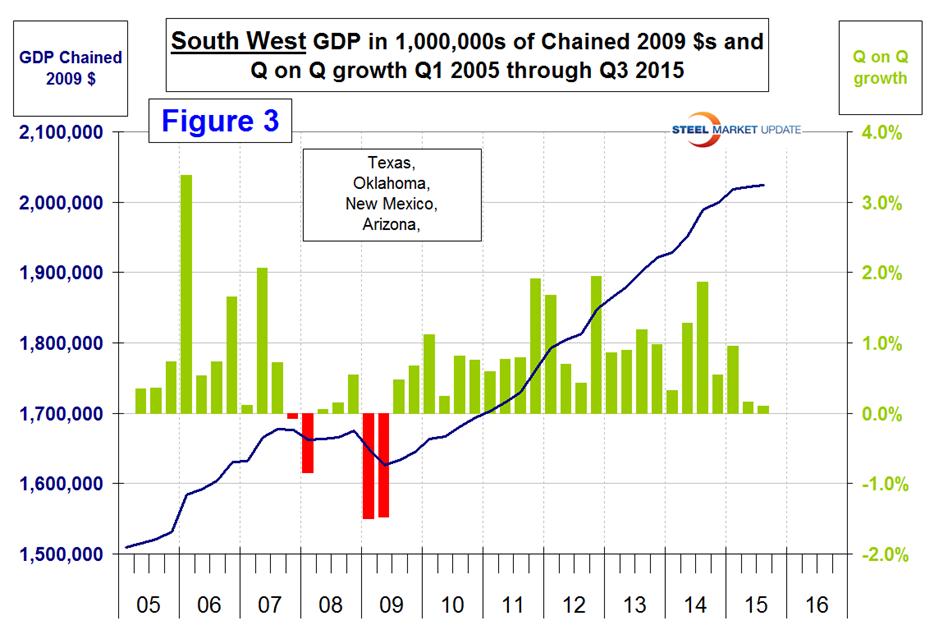
Figure 2 and Figure 3 are included to compare and contrast the New England and South West regions.
The U.S. values in this report differ from the National Income and Product Account (NIPA) values because of revisions to the NIPA values as well as the GDP-by-state accounts excluding Federal military and civilian activity located overseas (because it cannot be attributed to a particular state).


