

Market Data

August 21, 2016
SMU Flat Rolled Steel Market Trends Analysis
Written by John Packard
Last week Steel Market Update conducted our mid-August flat rolled steel market trends analysis. For those new to our newsletter, we invite approximately 600 people representing about 550 companies to participate in our bi-monthly questionnaire. Our normal response rate is 100 to 150 people. Last week’s mix was 44 percent service centers, 43 percent manufacturing companies, 5 percent trading companies, 4 percent steel mills and 4 percent toll processors.
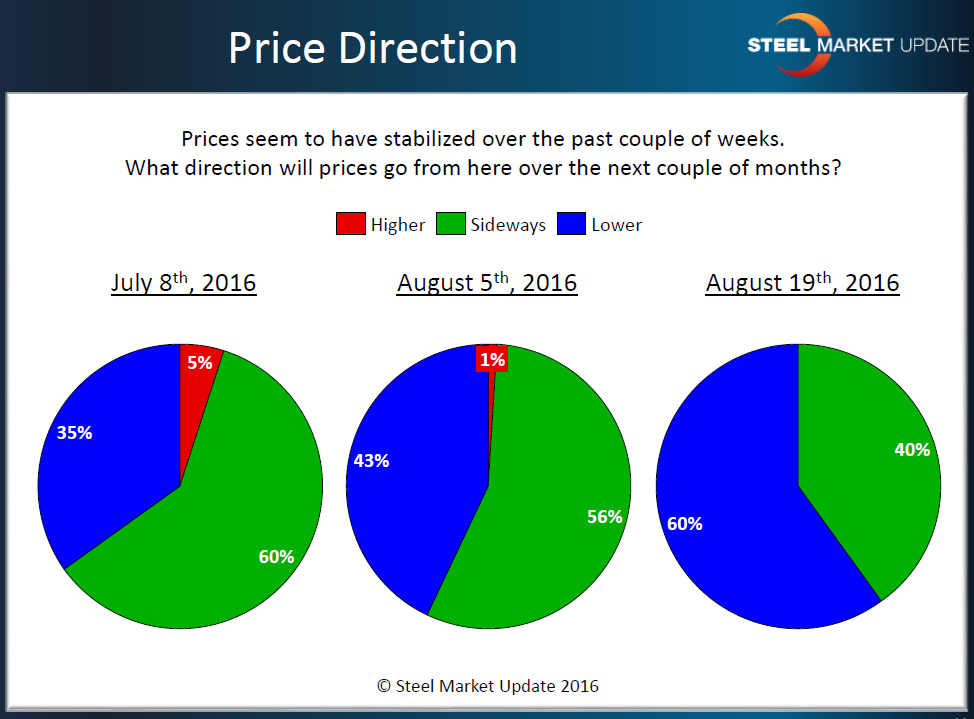
SMU has placed a question about what direction our respondents see flat rolled steel prices moving over the next couple of months. As you can see by the graphic below, our respondents are becoming more pessimistic about the ability of the steel mills to keep prices from dropping.
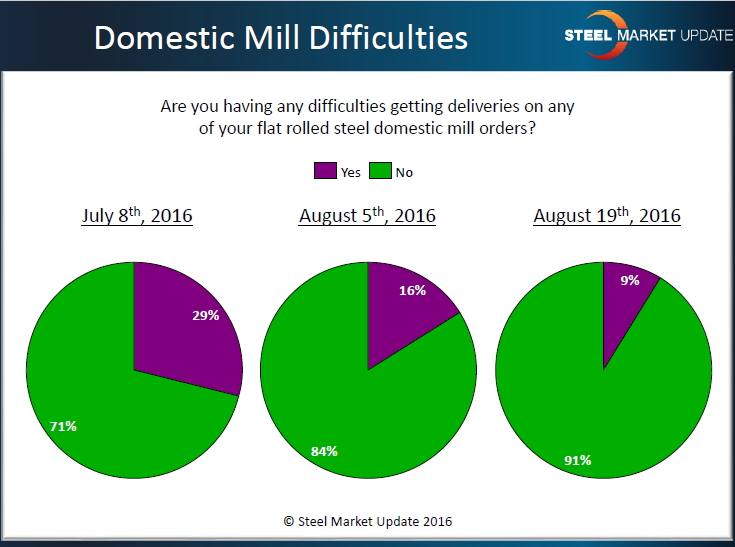
We discussed in our last issue the issue of lead times and negotiations. Another area we watch as a gauge of market direction is whether companies are having any difficulties getting deliveries out of their domestic mill suppliers. As you can see by the graphic below the percentage of late deliveries has shrunk from 29 percent in early July to 9 percent this past week.
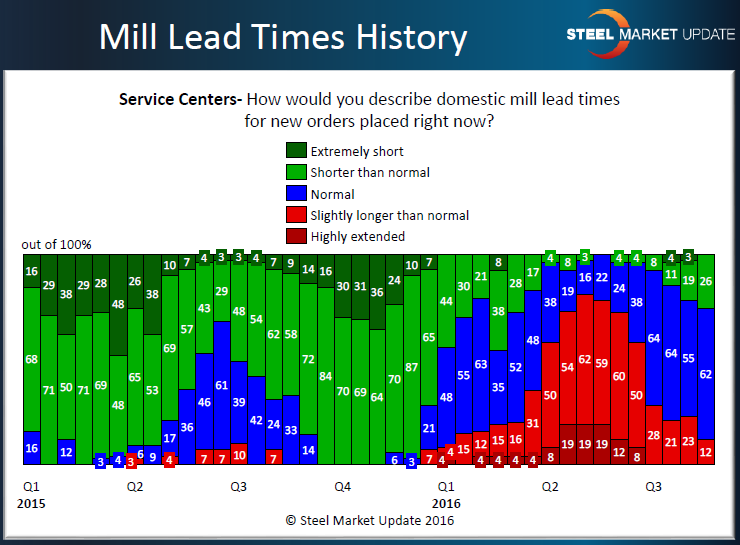
The improvement of delivery performance is related to lead times and as lead times shrink the ability to negotiate spot pricing improves. Our Premium level members have access to our Power Point slides as soon as our analysis has been completed at the end of each survey period. We conduct our surveys at the beginning of every month and then again on the 15th of the month. As you can see by the graphic provided below we try to provide details about the market in a historical context so our Premium level members can make the best decisions possible for their company. Lead times are now running at “normal” to “shorter than normal” according to the service centers who participated in last week’s questionnaire.
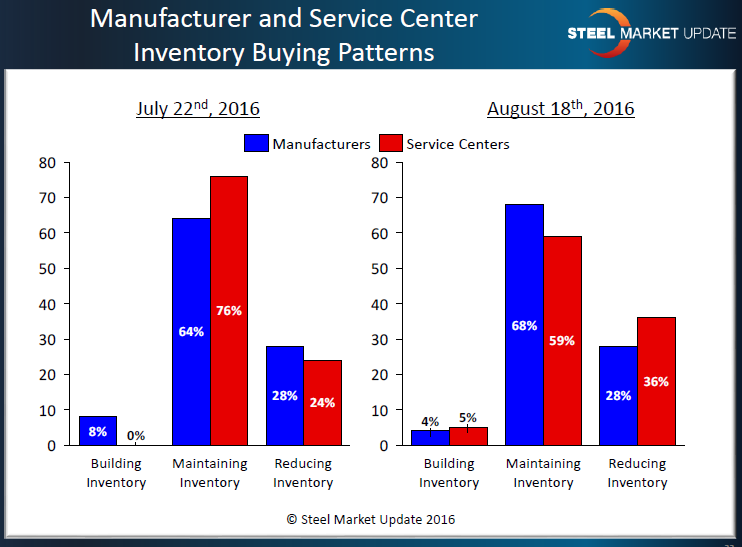
A question we have in our mind is why are lead times shrinking? Have buyers stopped buying (and does demand play a part if they have stopped buying or is it being caused by something else)? One way we get an indication of whether buyers have stopped buying is to take a look at whether manufacturing companies and service centers are building, reducing or maintaining inventories. As you can see by the graphic below the vast majority are maintaining inventories and there has been some growth in those who are reducing inventories (which stands to reason if prices are rolling over and starting to drop).
Our survey is also showing an increase in foreign steel purchases as the spread between domestic and foreign steel grows (especially cold rolled and coated steels which is where we are seeing the most action). If you would like to learn more about our surveys and what they are showing you can become a Premium level subscriber which includes access to the survey presentations. Contact us at info@SteelMarketUpdate.com for more details.


