

Analysis

August 23, 2016
US Vehicle Sales and NAFTA Vehicle Production through July 2016
Written by Peter Wright
Light vehicle (LV) sales bounced back to a seasonally adjusted annual rate (SAAR) of 17.9 million units in July from 16.7 million in June (Figure 1).
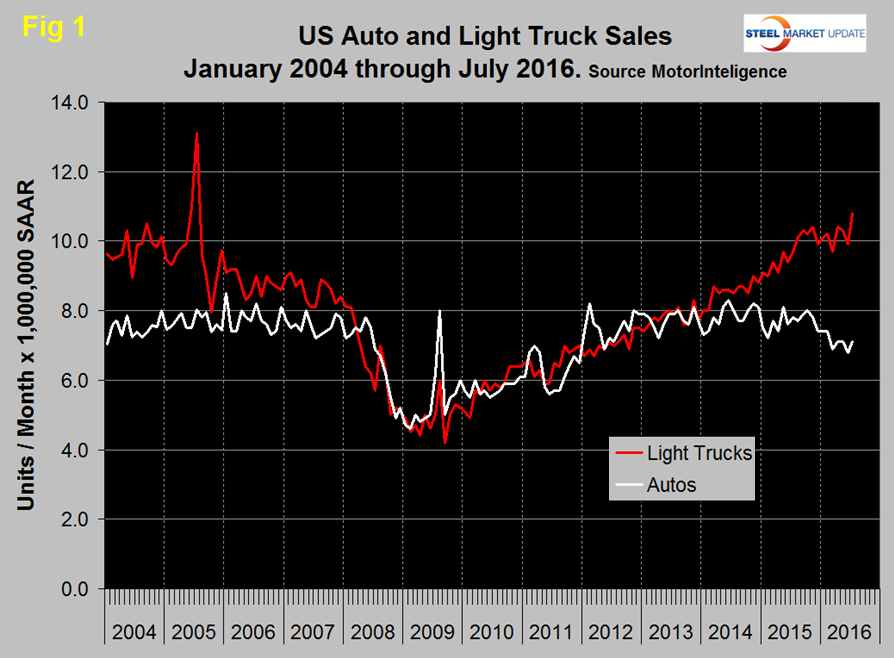
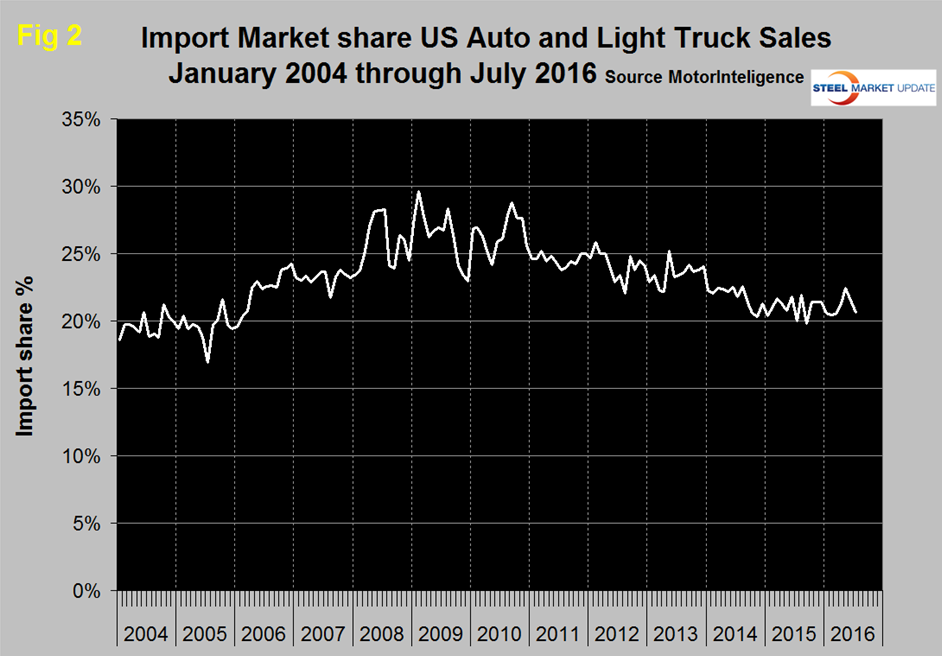
July was the best month since November last year. Autos rose from 6.8 to 7.1 million and light trucks rose from 9.9 to 10.8 million. The mix in July was 39.7 percent autos and 60.3 percent light trucks which includes crossovers. This was the first time in 12 years for light trucks to exceed 60 percent. Import market share fell to 20.7 percent from 21.6 percent in June (Figure 2).
Moody’s Analytics expects vehicle sales to remain above 17 million units SAAR for several more quarters and then ease slowly through the end of the decade. If income growth accelerates appreciably, interest rates and gasoline prices remain low, and used-vehicle prices and incentives stay high, the industry’s strong recent performance will persist. The wild card for the near term is how much pent-up demand for vehicles remains. Vehicle sales have remained above a level consistent with underlying demographics and economic fundamentals for three years.
Total light vehicle (LV) production in NAFTA in July was at an annual rate, of 14.281 million, down from 19.565 in June which was an all-time high. In cases where seasonality is more than a weather effect we like to compare the monthly result with the monthly norm over a number of years. On average since 2004, July’s production has been 29.0 percent lower than June as the auto companies took summer shutdowns for maintenance and re-tooling. This year production fell by 27.0 percent (Figure 3).
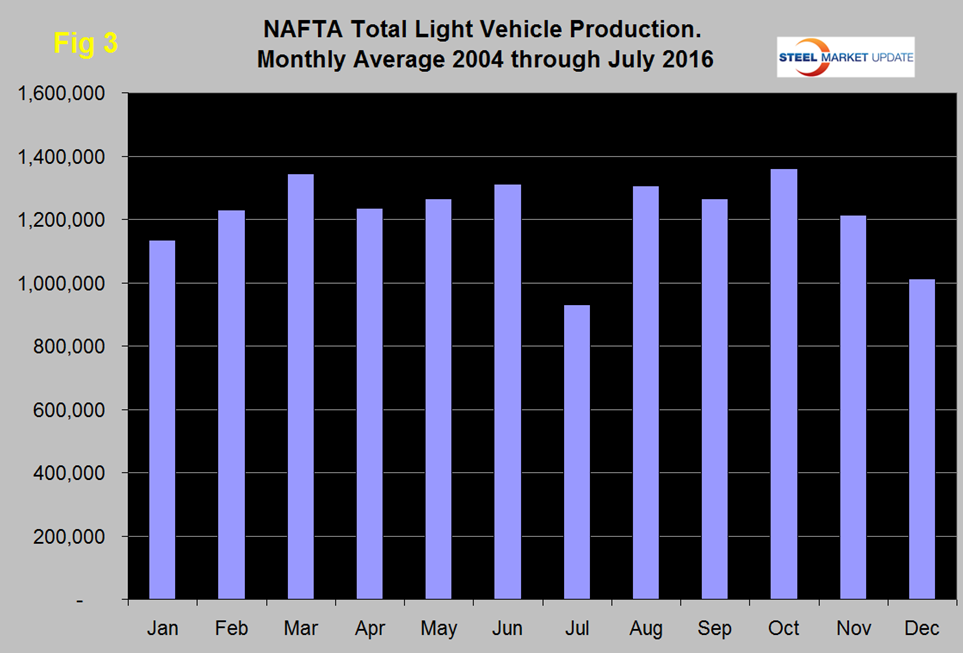
In August we can expect production to bounce back by about 40 percent. Reminder: these production numbers are not seasonally adjusted, the sales data reported above are seasonally adjusted. This year Ford announced that it would shorten the break for some of its SUV assembly plants in the US and Canada from two weeks to one to keep up with increased demand.
On a rolling 12 months basis y/y through July, LV production in NAFTA increased by 2.4 percent which was down from 3.4 percent in months through June but is still consistent with the growth experienced in the last 12 months as indicated by the brown bars in Figure 4.
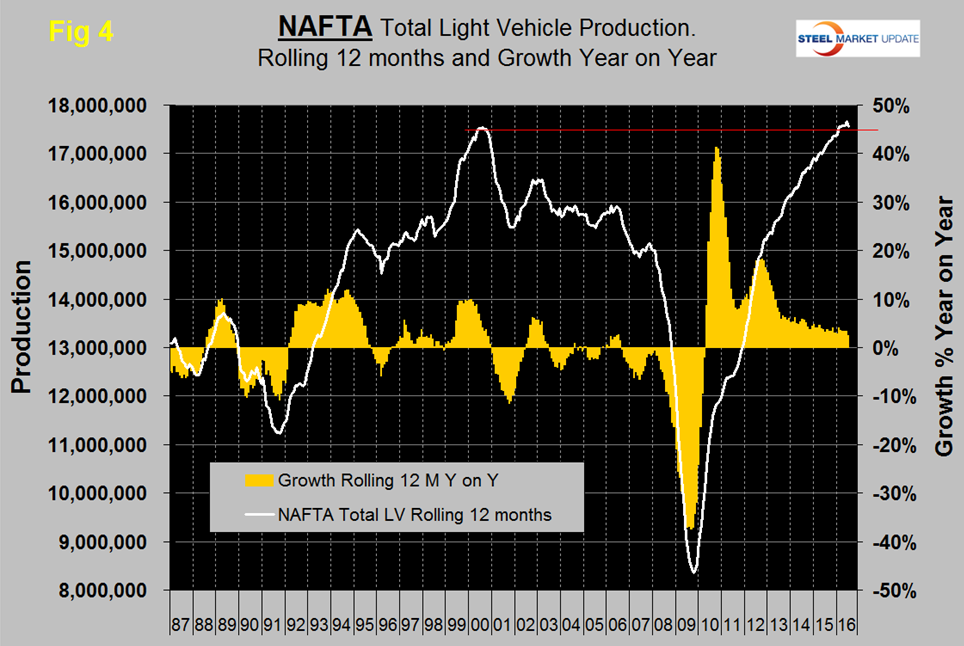
On this basis production has been at an all-time high for the last six months. On a rolling 12 months basis y/y the US was up by 2.0 percent with negative momentum, Canada was up by 6.9 percent with negative momentum and Mexico was up by 0.9 percent with positive momentum (Table 1).
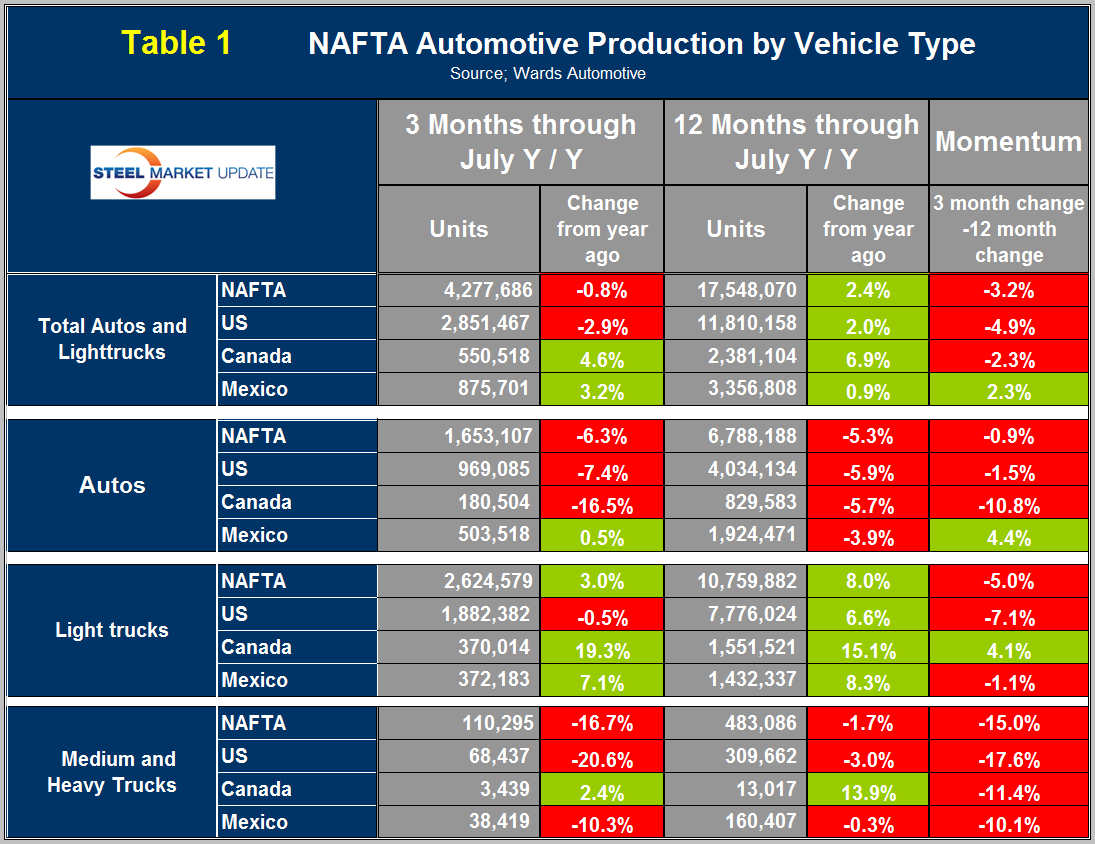
This was the first month for Mexico to have positive momentum in fourteen straight months. Canada experienced negative momentum in July following very strong momentum in the previous six months. Mexico has gained production share in the last three months at the expense of both the US and Canada (Figure 5).
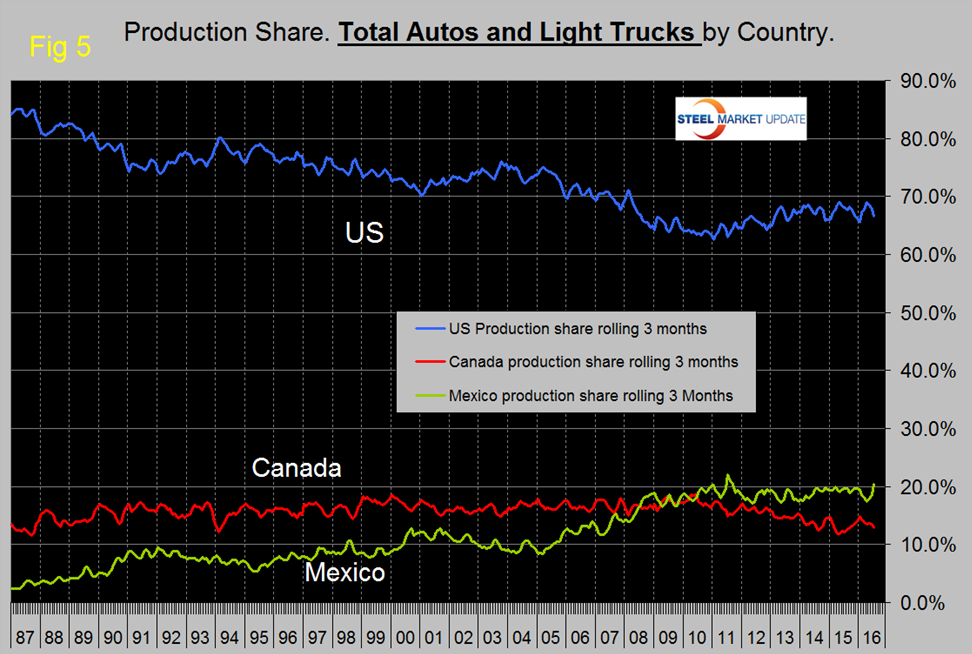
In July on a rolling three month basis, the US production share of total light vehicles was 66.7 percent, down from 69.0 in April, Canada’s was 12.9 percent, down from 14.9 percent in January and Mexico’s was 20.5 percent, up from 17.4 percent in April and the first time to exceed 20 percent since August 2011. Production in Mexico in 2014 was 3.2 million units, in 2015 was 3.4 million units and YTD 2016 through July was 3.338 million units annualized. The Mexican production target for 2020 in 5.0 million units according to Eduardo Solis, president of the Mexican Automotive Industry Association.
Figures 6, 7 and 8 show total LV production by country with y/y growth rates and on each the red line shows the change in production since Q2 2006.
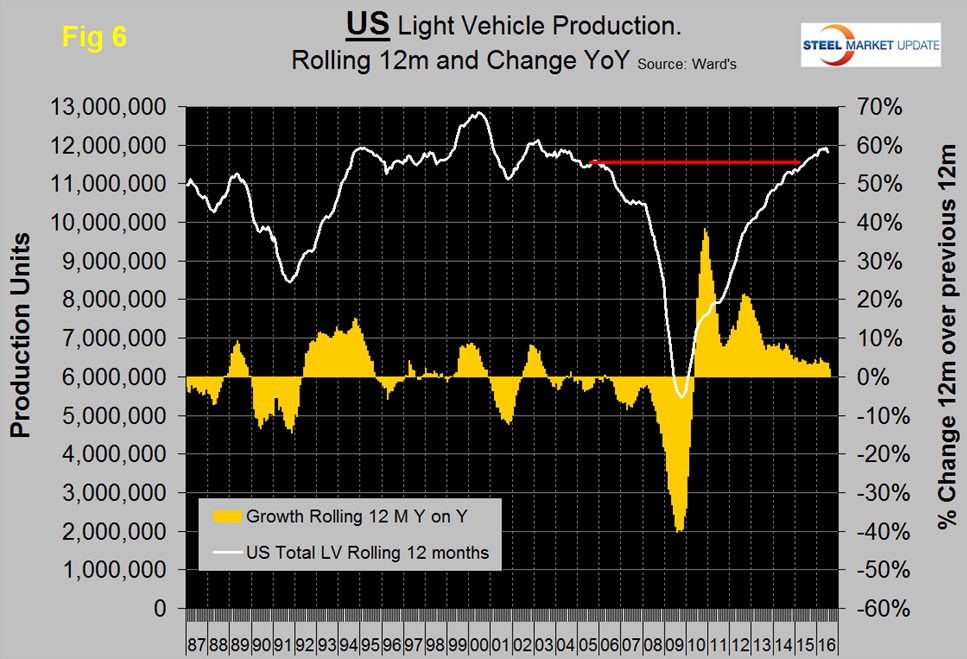
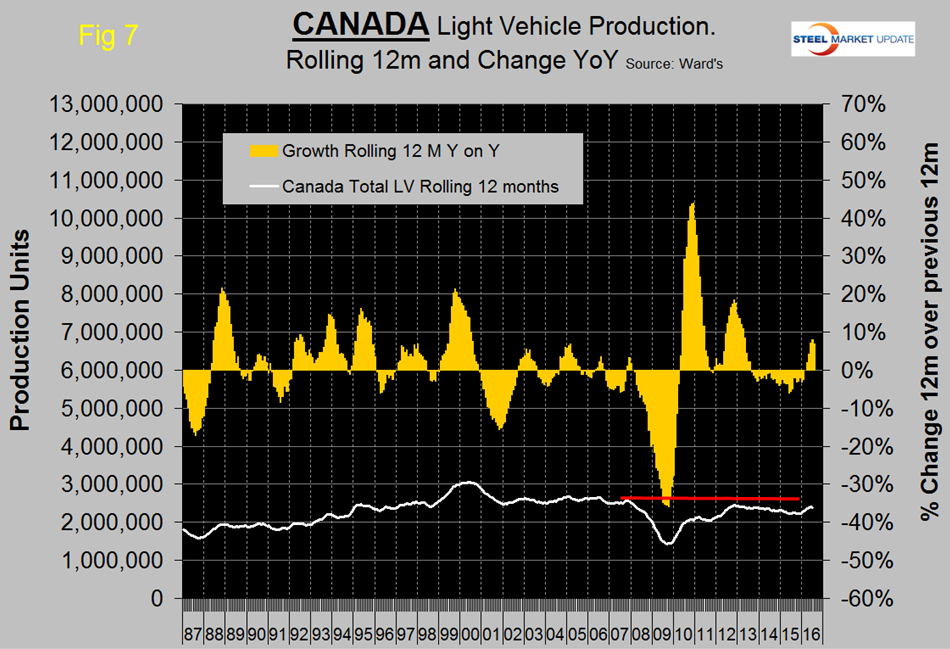
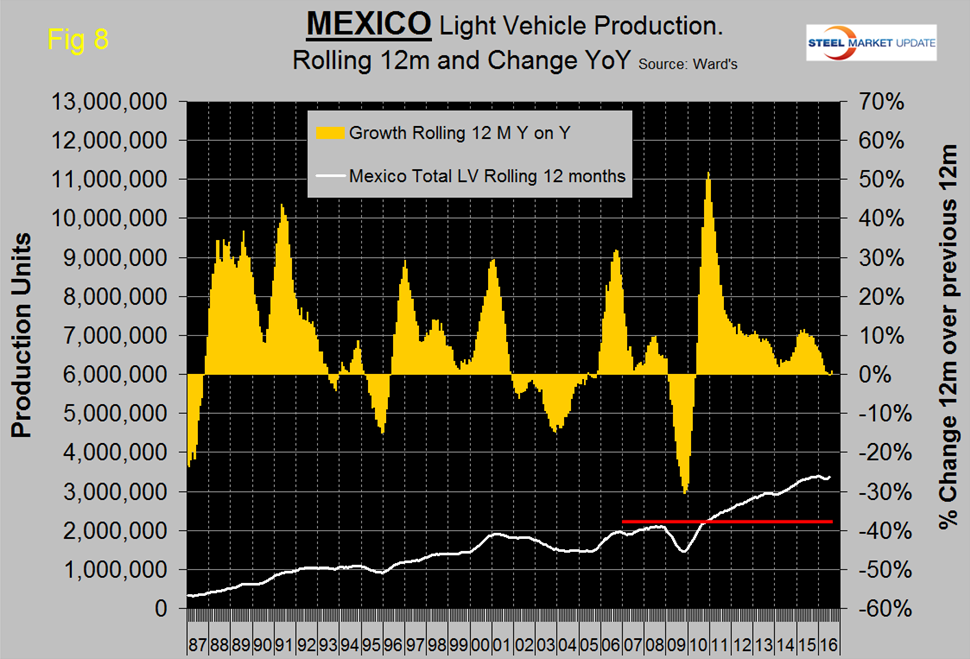
Note the scales are the same to give true comparability and that Mexican growth has slowed significantly this year and is now the lowest in NAFTA. Canada has had a growth surge in the last five months and the first positive values since July 2013. Canada’s growth is now the highest in NAFTA. During the recession Mexico declined by less than the US and bounced back by more during the recovery. This caused Mexico’s production share to surge until Mid-2011 at the expense of the US.
Figure 9 shows the percentage of autos in the light vehicle production of each country.
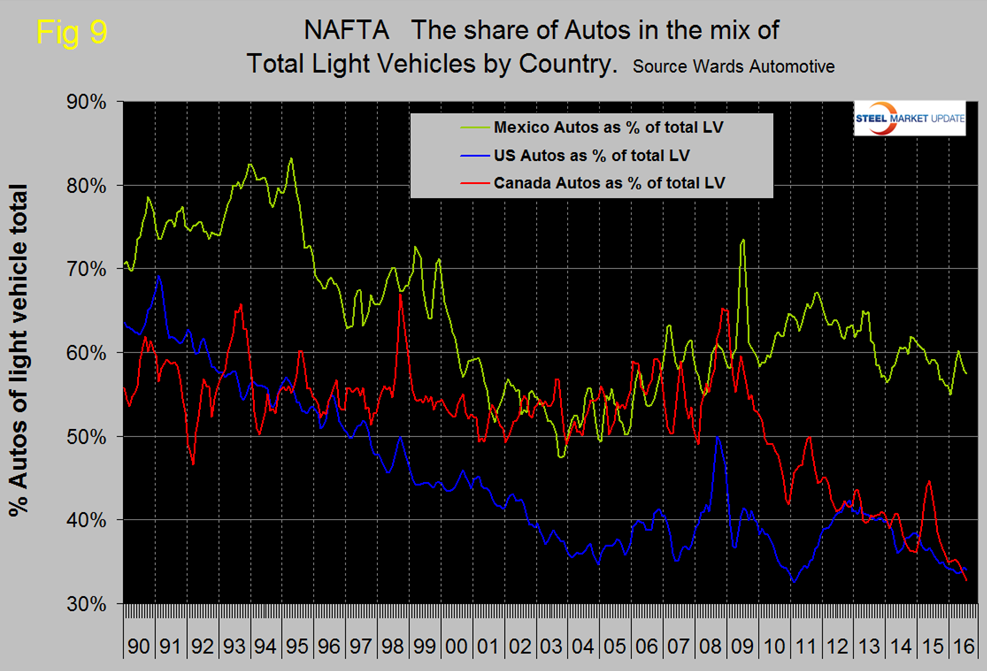
The percentage of autos in the production mix of all three countries has been declining, driven by consumer buying preferences which in turn are heavily influenced by gas prices. The change in preference for light trucks tends to favor the US and Canada over Mexico because the mix of light vehicle production capacity is so different by country. The percentage of autos in the Mexican mix in the last three months was 57.5 percent but only 34.0 in the US and 32.8 percent in Canada. This means that Mexico has staked out a higher relative capacity in autos which will serve it well when gas prices eventually rebound. The Detroit Free Press reported at the beginning of August that Fiat Chrysler Automotive will cease production of autos in the US in the first months of 2017. Their US plants will focus entirely on the production of pickup trucks and SUVs for the RAM and Jeep brands. The company will move production of the Dodge Dart and Chrysler 200 to Canada, Mexico and overseas.
Ward’s Automotive reported this week that total light vehicle inventories in the US decreased by five days to 61 in July which was 3 days more than July last year. Month over month FCA (Fiat Chrysler Automotive) was unchanged at 81 days, Ford was down by 2 to 76 days and GM was down by 6 to 66 days.
The SMU data file contains more detail than be shown here in this condensed report. Readers can obtain copies of additional time based performance results on request if they wish to dig deeper. Available are graphs of auto, light truck and medium and heavy truck production and growth rate and production share by country.


