

Analysis

December 23, 2016
US Vehicle Sales and NAFTA Vehicle Production through November 2016
Written by Peter Wright
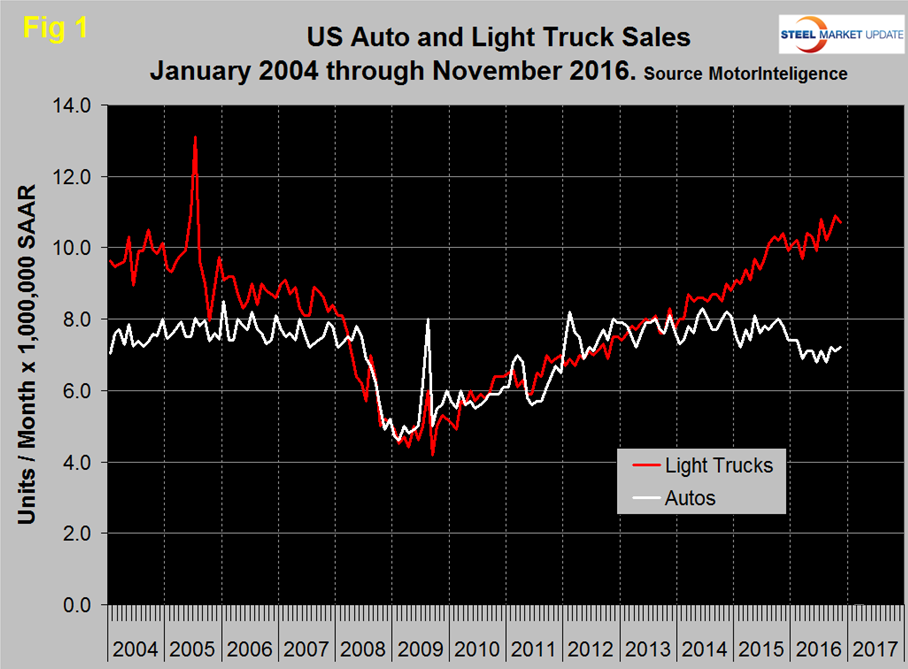
Vehicle sales fell slightly to 17.87 million units on a seasonally adjusted annualized basis in November, though this still beat expectations. The strengthening job market is supporting vehicle sales and will continue to do so through next year as an average of 170,000 jobs are estimated to be added per month. On the other side of the equation the OPEC announcement of a supply cut could see oil prices rise past Moody’s forecast for $60 per barrel by the end of next year, which would filter down to higher gasoline prices and dampen demand for new autos. Vehicle sales will also face a headwind from financing following the Federal Reserve rate hike and the expectation of more to come. Figure 1 shows auto and light truck sales monthly and that all the growth in the last year has been in light trucks.
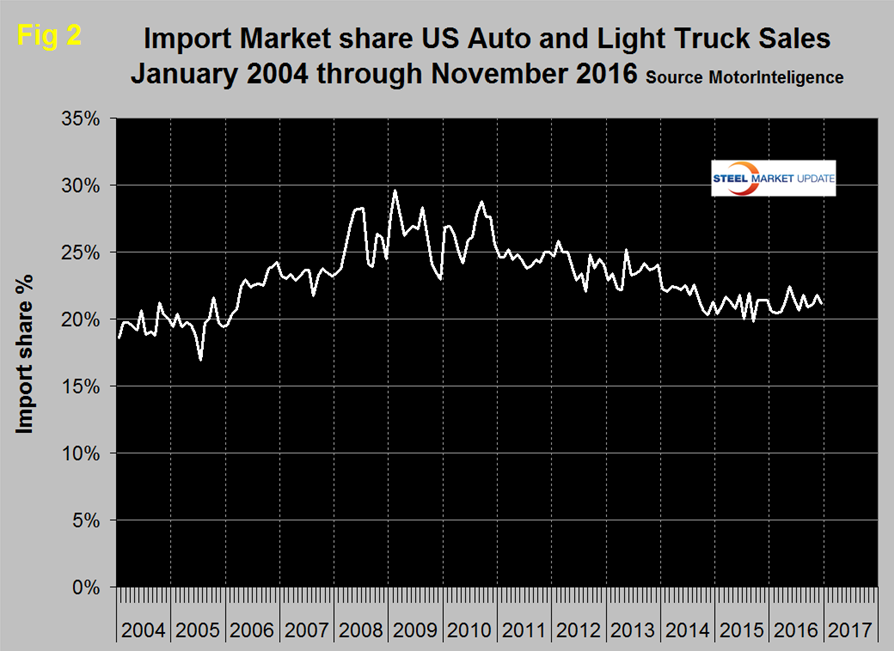
Import market share has been more or less flat in the same time period (Figure 2).
Total light vehicle (LV) production in NAFTA in November was at an annual rate, of 17.921 million units, down from 18.995 million in October. In cases where seasonality is more than a weather effect we like to compare the monthly result with the monthly norm over a number of years. On average since 2004, November’s production has been 10.3 percent lower than October. This year production declined by 5.7 percent therefore we see November’s report as positive in the long term context (Figure 3).
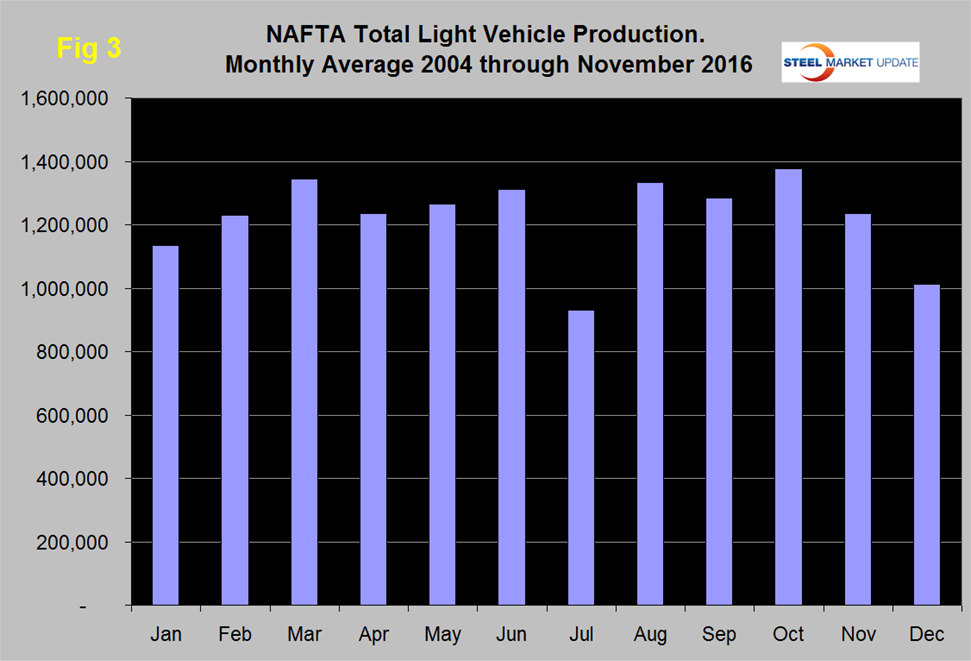
We can expect December’s production to decline by about 18 percent. Reminder: production numbers are not seasonally adjusted, the sales data reported above are seasonally adjusted.
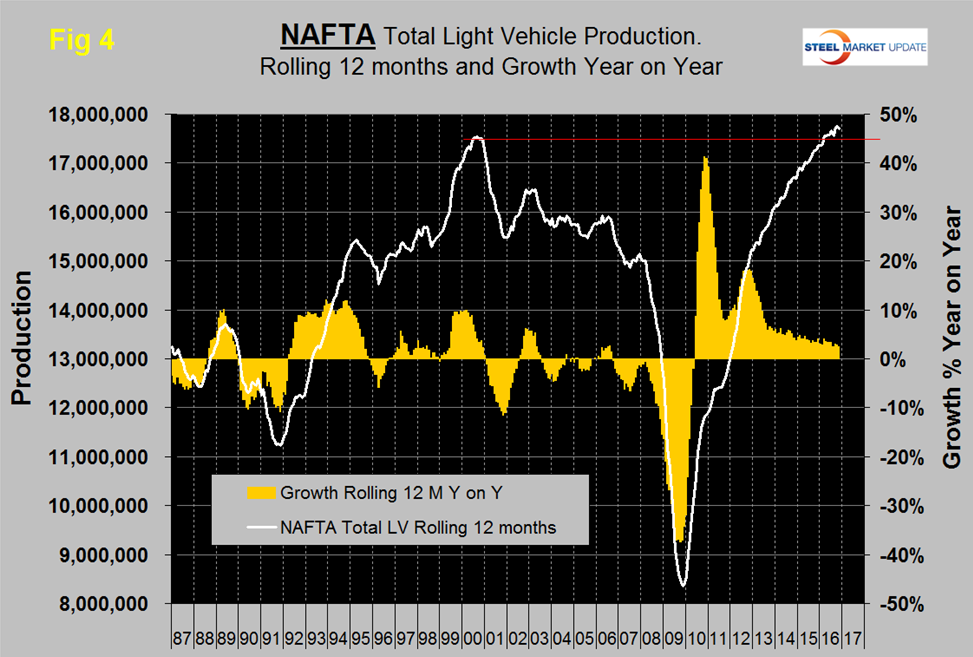
On a rolling 12 months basis y/y through November, LV production in NAFTA increased by 2.5 percent which was down from 2.9 percent in 12 months through October. There has been a very gradual slowdown in growth for the last three years as indicated by the brown bars in Figure 4, however production has been at an all-time high every month in 2016.
On a rolling 12 months basis y/y the US was up by 1.6 percent with negative momentum, Canada was up by 6.6 percent with negative momentum and Mexico was up by 1.8 percent with positive momentum (Table 1).
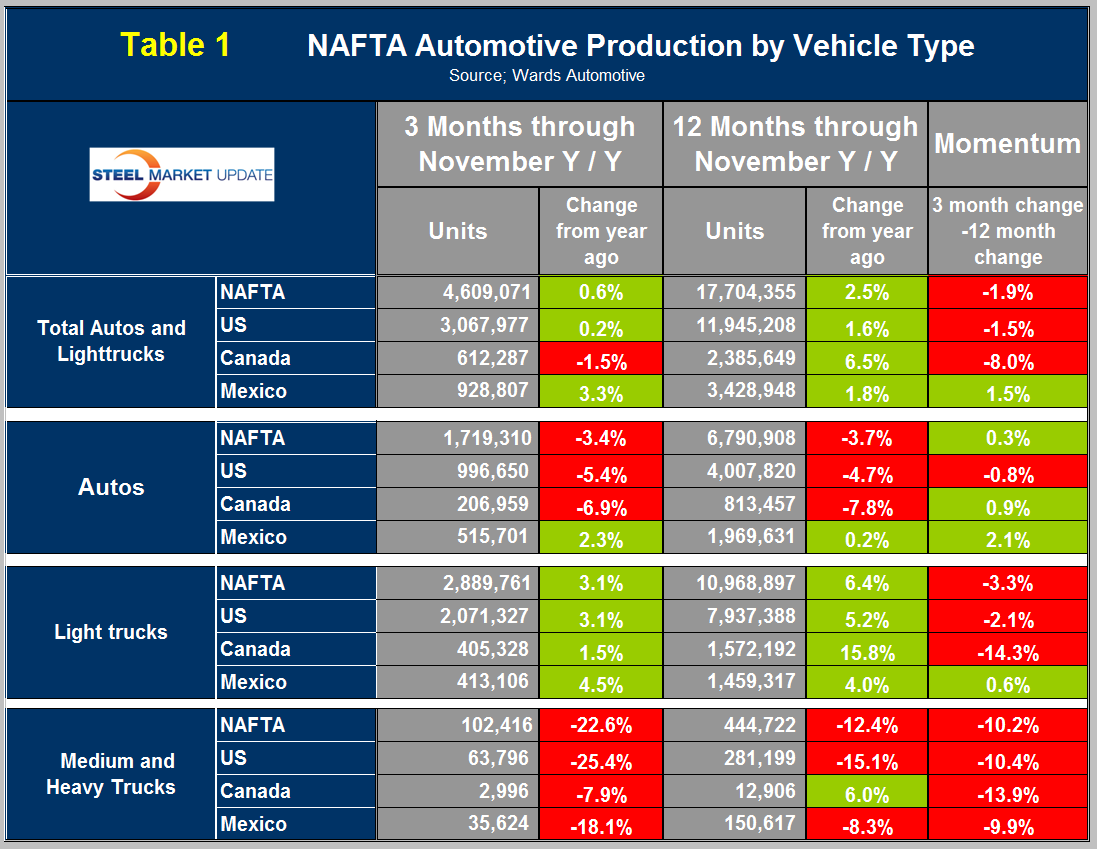
The five months July through November were the first months for Mexico to have positive momentum after fourteen straight months of slowdown. Canada experienced negative momentum in July through November following very strong momentum in the previous six months. On a rolling 3 months basis in 2016, Mexico has gained production share mainly at the expense of Canada (Figure 5) and the Mexican and US shares have been almost mirror images of each other as production has shifted backwards and forwards across the border with not much net change.
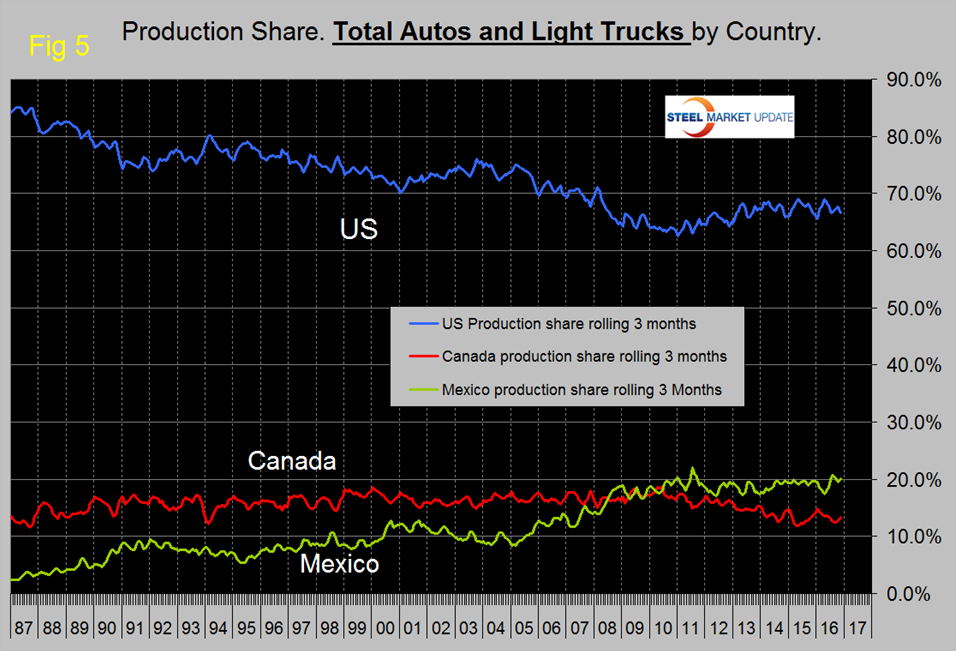
In November on a rolling three month basis, the US production share of total light vehicles was 66.6 percent which was slightly lower than the 67.3 percent for the year. Canada’s was 13.3 percent which was almost the same as the 13.3 percent monthly average for the year. Mexico’s was 19.2 percent which was one percent better than the average for the year. Production in Mexico in 2014 was 3.2 million units, in 2015 was 3.4 million units and through November 2016 annualized was 3.498 million units. The Mexican production target for 2020 in 5.0 million units according to Eduardo Solis, president of the Mexican Automotive Industry Association.
Figures 6, 7 and 8 show total LV production by country with y/y growth rates and on each the red line shows the change in production since Q2 2006.
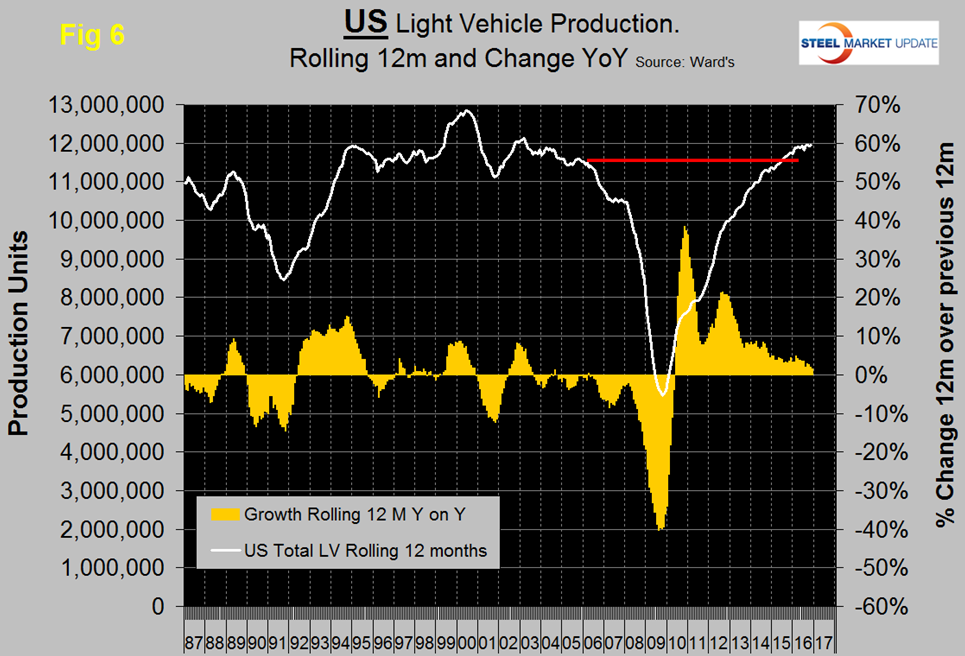
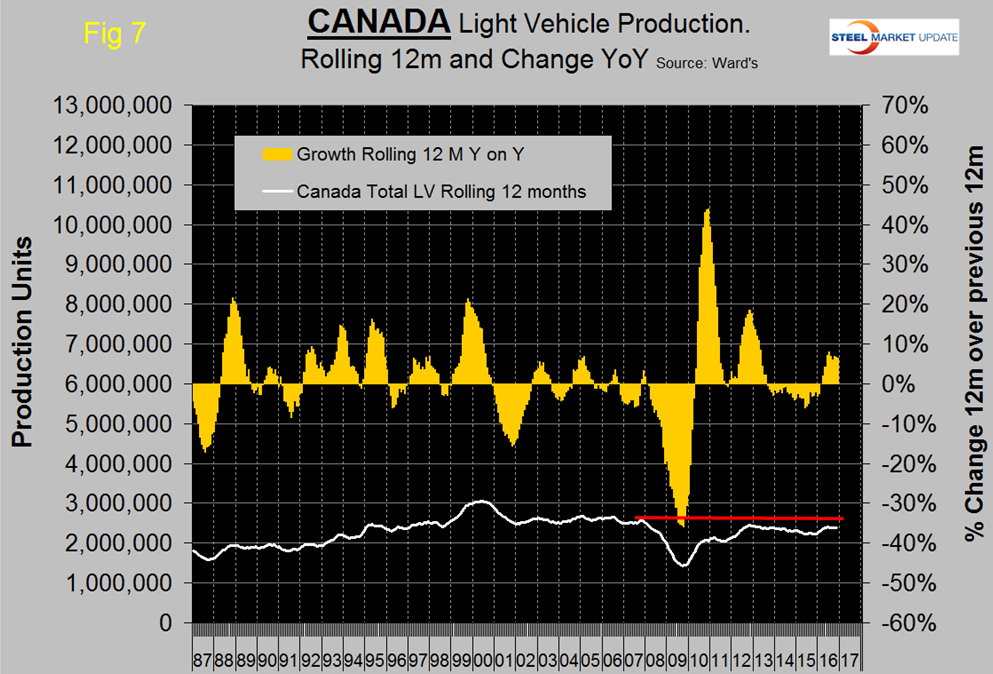
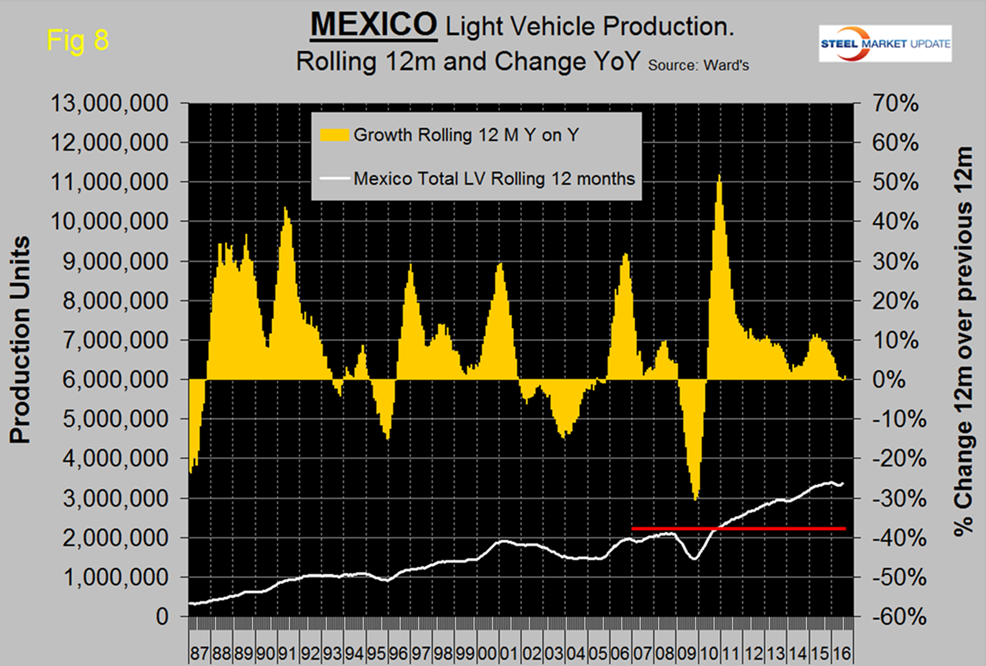
Note the scales are the same to give true comparability and that Mexican growth has slowed significantly this year and on a rolling 12 months basis is the lowest in NAFTA. During the recession Mexico declined by less than the US and bounced back by more during the recovery. This caused Mexico’s production share to surge until Mid-2011 at the expense of the US.
Figure 9 shows that the percentage of autos in the light vehicle production of each country has been declining in all three cases since 2012, driven by consumer buying preferences which in turn are heavily influenced by gas prices.
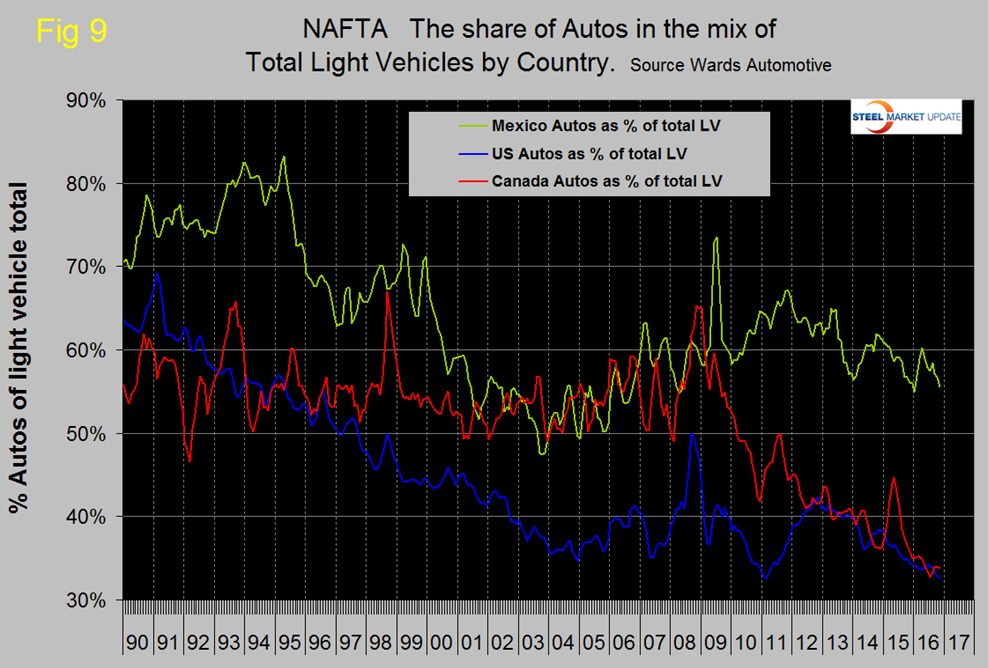
The change in preference for light trucks tends to favor the US and Canada over Mexico because the mix of light vehicle production capacity is so different by country. The percentage of autos in the Mexican mix in the last three months was 55.5 percent but only 32.5 in the US and 33.8 percent in Canada. This means that Mexico has staked out a higher relative capacity in autos which will serve it well when gas prices eventually rebound.
Ward’s Automotive reported this week that total light vehicle inventories in the US were 73 days at the end of November, which was the same as the end of October nut up from 64 days at the end of November last year. Month over month FCA (Fiat Chrysler Automotive) was up by 9 days to 93, GM was up by 2 also to 86 and Ford was down by 7 to 82 days.
The SMU data file contains more detail than be shown here in this condensed report. Readers can obtain copies of additional time based performance results on request if they wish to dig deeper. Available are graphs of auto, light truck and medium and heavy truck production and growth rate and production share by country.


