Market Data

January 31, 2017
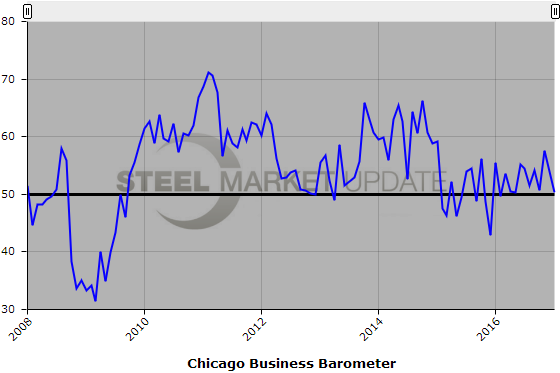
Chicago Business Barometer Falls to May 2016 Level
Written by Sandy Williams
The Chicago Business Barometer lost 3.6 points in January, registering 50.3 from a revised 53.9 in December. The Barometer was at its lowest level since May 2016, after a strong fourth quarter averaging 54.3, said MNI Indicators.
New orders fell by 7.8 points dipping into contraction and dragging down the composite index. Production fell 2.3 points to 56.0 and employment levels were below the neutral point for the third straight month. Order backlogs increased, although remaining in contraction territory, and supplier deliveries lengthened to the highest level since May 2016. Inventories decreased at the fastest pace since May, pushing the inventory index down 2.7 points this month.
The prices paid index rose to its highest level since September 2014, registering 61.4.
“Business activity in the New Year got off to a slow start with contracting orders and easing production weighing heavily on hiring intentions. Activity in Q1 is usually weaker due to seasonal factors, so the following surveys will provide a better picture of business performance.”
“Respondents to our survey did not expect to be affected by rate increases by the Fed in 2017. Although cost of capital is expected to increase, firms seemed to have already factored this into their purchase decisions,” said Shaily Mittal, senior economist at MNI Indicators.
About the Chicago Business Barometer
The Chicago Business Barometer, produced by MNI Indicators, is a closely watched leading indicator of U.S. economic activity and is based on a survey panel of purchasing/supply chain professionals, primarily drawn from membership of the Institute for Supply Management-Chicago (ISM-Chicago). The survey panel contains both manufacturing and non-manufacturing firms, many with global operations.
The Barometer is a composite diffusion indicator made up of the Production, New Orders, Order Backlogs, Employment and Supplier Deliveries indicators and is designed to predict future changes in US gross domestic product (GDP). An indicator reading above 50 indicates expansion compared with a month earlier while below 50 indicates contraction. A result of 50 is neutral. The farther an indicator is above or below 50, the greater or smaller the rate of change.
Below is a graph showing the history of the Chicago Business Barometer. You will need to view the graph on our website to use its interactive features, you can do so by clicking here. If you need assistance logging into or navigating the website, please contact our office at 800-432-3475 or info@SteelMarketUpdate.com.