Market Data

February 28, 2017
Chicago Business Barometer Jumps to 57.4 in February
Written by Sandy Williams
The February Chicago Business Barometer reached its highest reading since January 2016. The Barometer rose 7.1 points to 57.4 buoyed by optimism and gains in new orders and production.
Four of the five components of the Barometer increased in February. New orders rose 10.1 points after slipping below the 50 neutral mark in January. Production was up 4.3 points to a 13 month high of 60.3. Backlogs were still below the breakeven point but rose for a second consecutive month. Supplier deliveries were at their lowest level since October 2016.
Employment expanded for the first time in four months and was at the highest index reading since October 2014.
The inventory index grew by 15.3 points, moving past the neutral point for the first time in three month as firms restocked to keep up with demand. The prices paid index increased 7.2 points to register 68.6.
“The sharp bounce back in optimism to a level not seen in over two years and growth in output at the highest level for over a year offers an upbeat picture of the US economy,” said Shaily Mittal, senior economist at MNI Indicators.
“The latest survey shows a continuance of price increases, with Prices Paid at the highest level since September 2014. With inflationary pressures on the rise and the job market having improved, the next rate hike could come soon, possibly in the coming quarter,” she added.
About the Chicago Business Barometer
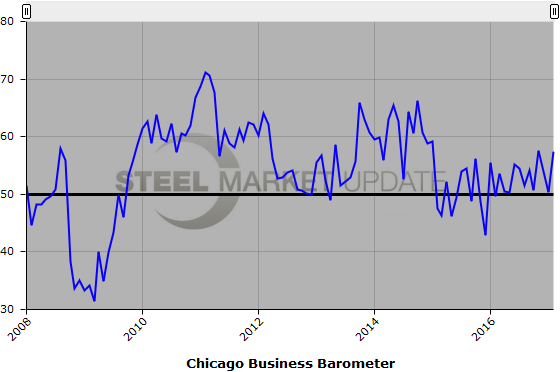
The Barometer is a composite diffusion indicator made up of the Production, New Orders, Order Backlogs, Employment and Supplier Deliveries indicators and is designed to predict future changes in US gross domestic product (GDP). An indicator reading above 50 indicates expansion compared with a month earlier while below 50 indicates contraction. A result of 50 is neutral. The farther an indicator is above or below 50, the greater or smaller the rate of change.
Below is a graph showing the history of the Chicago Business Barometer. You will need to view the graph on our website to use its interactive features, you can do so by clicking here. If you need assistance logging into or navigating the website, please contact our office at 800-432-3475 or info@SteelMarketUpdate.com.