

Market Data

June 7, 2018
Steel Mill Lead Times: HR Peaked, Coated Up
Written by Tim Triplett
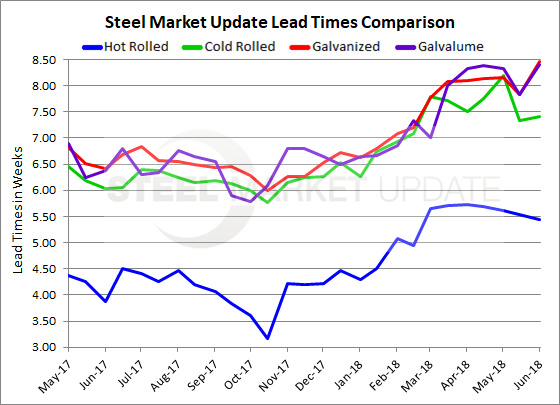
Mill lead times for hot rolled steel appear to have peaked in the current market cycle, while lead times for coated steels extended a bit in the past few weeks, according to Steel Market Update’s latest market trends data. Lead times for hot rolled now average about five and a half weeks, cold rolled about seven and a half weeks, and galvanized and Galvalume nearly eight and a half weeks.
Lead times on hot rolled steel peaked in early April at 5.73 weeks and have continued to shorten. Hot rolled lead times now average 5.45 weeks based on the responses from this week’s flat rolled steel market trends questionnaire. They are still extended compared with a year ago, however, when HRC lead times averaged 3.88 weeks.
Cold rolled lead times are at 7.40 weeks, about what they have averaged since the beginning of the year. Cold roll lead times have been as short as 6.27 weeks in early January and as high as 8.19 weeks in early May. Last year at this time, CR lead times averaged 6.03 weeks.
Demand for coated steels is particularly strong. Unlike hot rolled and cold rolled, lead times for galvanized and Galvalume have both extended by about half a week since mid-May. The current lead time for galvanized is 8.46 weeks and Galvalume is 8.40 weeks.
Lead times for steel delivery are a measure of demand at the mill level. The more extended the lead time, the busier the mills.
Note: These lead times are based on the average from manufacturers and steel service centers who participated in this week’s SMU market trends analysis. Our lead times do not predict what any individual may get from any specific mill supplier. Look to your mill rep for actual lead times. Our lead times are meant only to identify trends and changes in the marketplace. To see an interactive history of our Steel Mill Lead Times data, visit our website here.


