

Market Data
May 22, 2019
SMU Energy Analysis: Oil Price Declines, But Market's Bullish
Written by Peter Wright
Monthly oil production in the U.S. declined sharply in February as inventories increased. The price of West Texas Intermediate crude oil has declined in the last month.
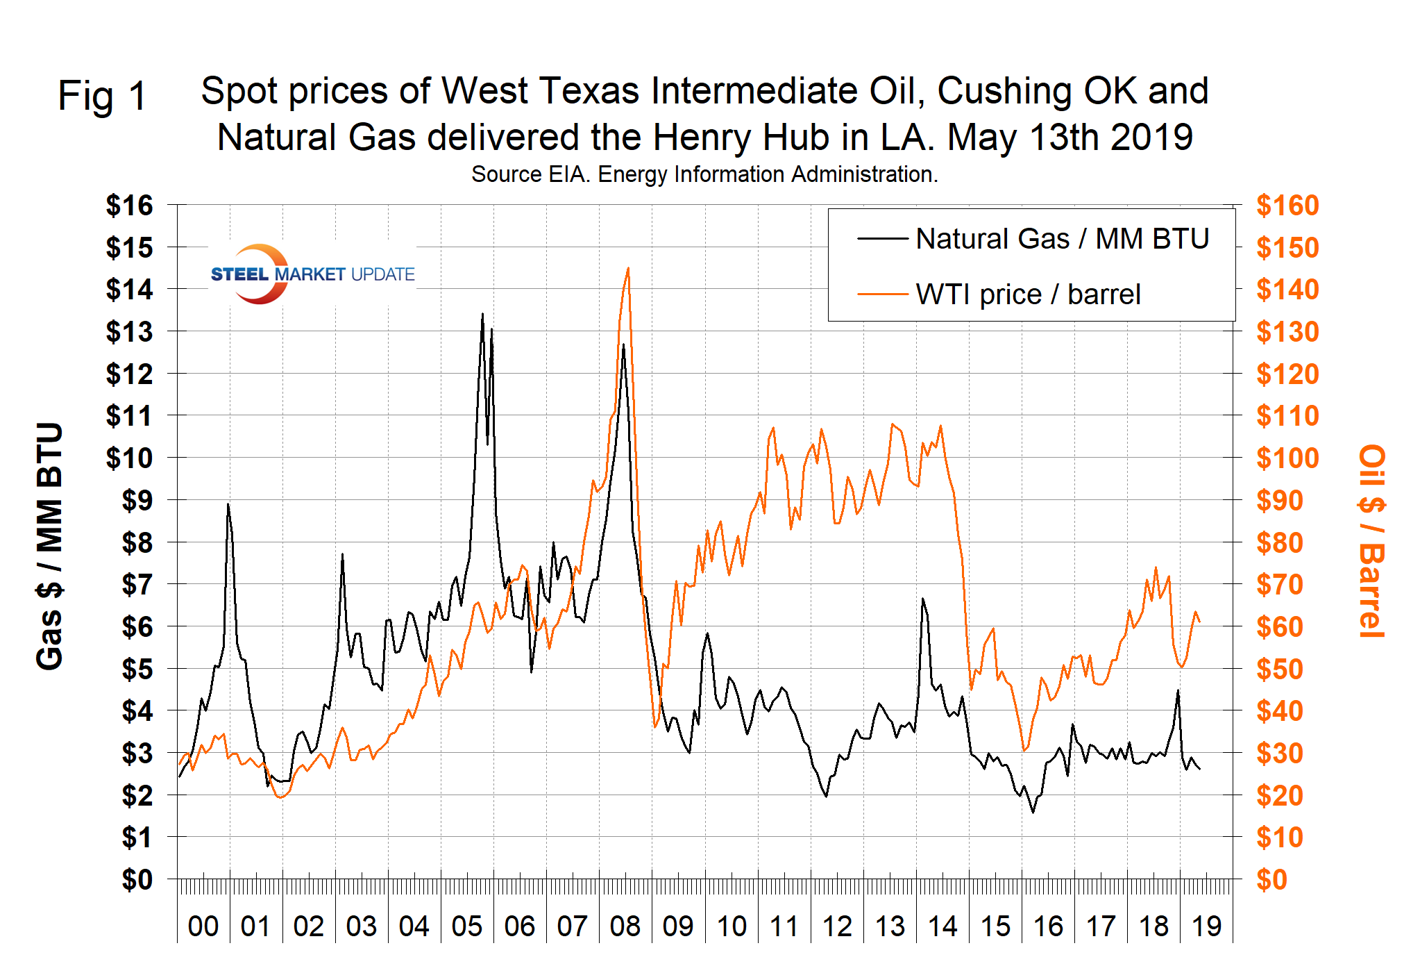
The spot price of West Texas Intermediate (WTI) FOB Cushing, Okla., reached $66.24 / barrel on April 20 and had declined to $60.97 on May 13. The total number of operating rigs exploring for oil has declined by 88 since Jan. 4. The prices of oil and natural gas drive the consumption of energy-related steel products including oil country tubular goods, pipe fittings and well head equipment, among others. Welded tubular goods (not including OCTG) consumed about 5.5 million tons of hot rolled sheet in 2018.
![]()
Figure 1 shows historical oil and gas prices from January 2000 through May 13, 2019. Our price and inventory data come from the EIA (Energy Information Administration). On May 10 (latest data available), natural gas at the Henry Hub in Oklahoma was priced at $2.60/MM BTU, down from $3.50 on Jan. 25.
On May 18, equities analyst Daniel Jones wrote: “It appears as though the market is really looking up for oil bulls. Despite production rising globally, supply figures look appealing, and with OPEC’s output constrained, it looks highly likely that the market will only get better for bulls from here. OPEC’s crude production report for April shows there were a number of large swings from several of the group’s members. The most significant movement came from Iran, which saw its oil output decline 0.164 million barrels per day from 2.718 million barrels per day in March to 2.554 million barrels per day in April. This drop can almost certainly be explained by the ratcheting up of sanctions and the (realized) fear that waivers for certain nations buying crude from Iran would not be renewed. The only other big move on the downside during the month was Saudi Arabia, which produced 9.742 million barrels per day, 45,000 barrels per day lower than what we saw in March. Over the next few months, it’s likely that output from Saudi Arabia will stay mostly flat (adjusted for any increases to cover for losses from Iran), but as recent news has indicated, there are heightened geopolitical risks caused by the Trump Administration’s harsh stance on Iran. Output in Iraq will probably grow some during this time, but nations like Libya, Nigeria and especially Venezuela should see extreme volatility, with the first two nations seeing real upside and downside, while Venezuela’s path should be mostly toward lower output.”
On May 10, the EIA reported that U.S. commercial crude oil inventories (excluding those in the Strategic Petroleum Reserve) rose by 3.6 million barrels from the previous week and year to date were up by 24.7 million barrels. Figure 2 shows the inventory level, including the Strategic Petroleum Reserve and the year-over-year change.
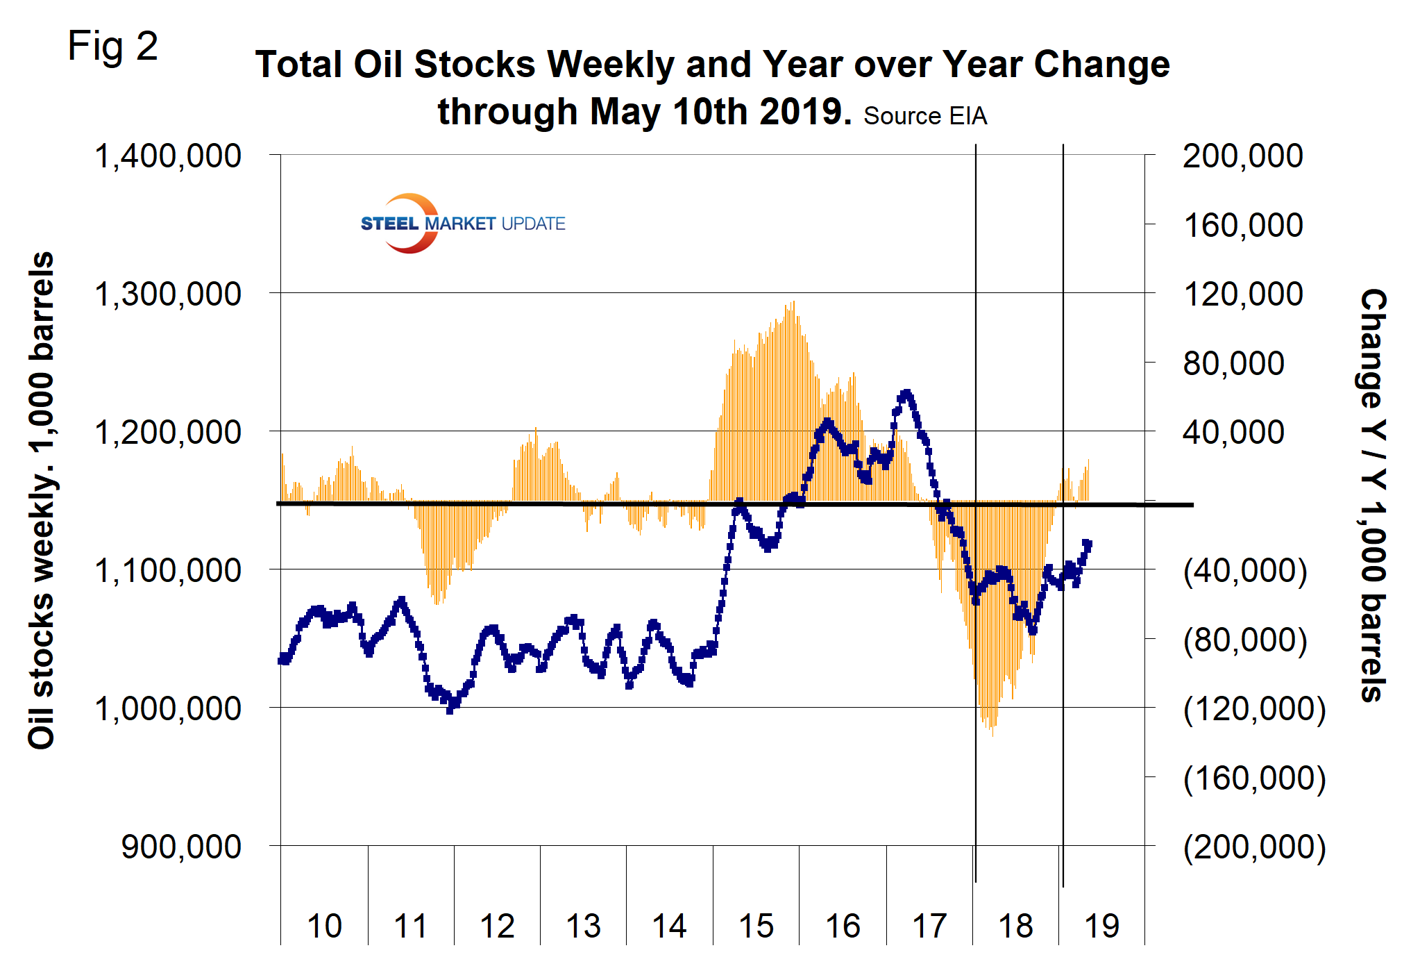
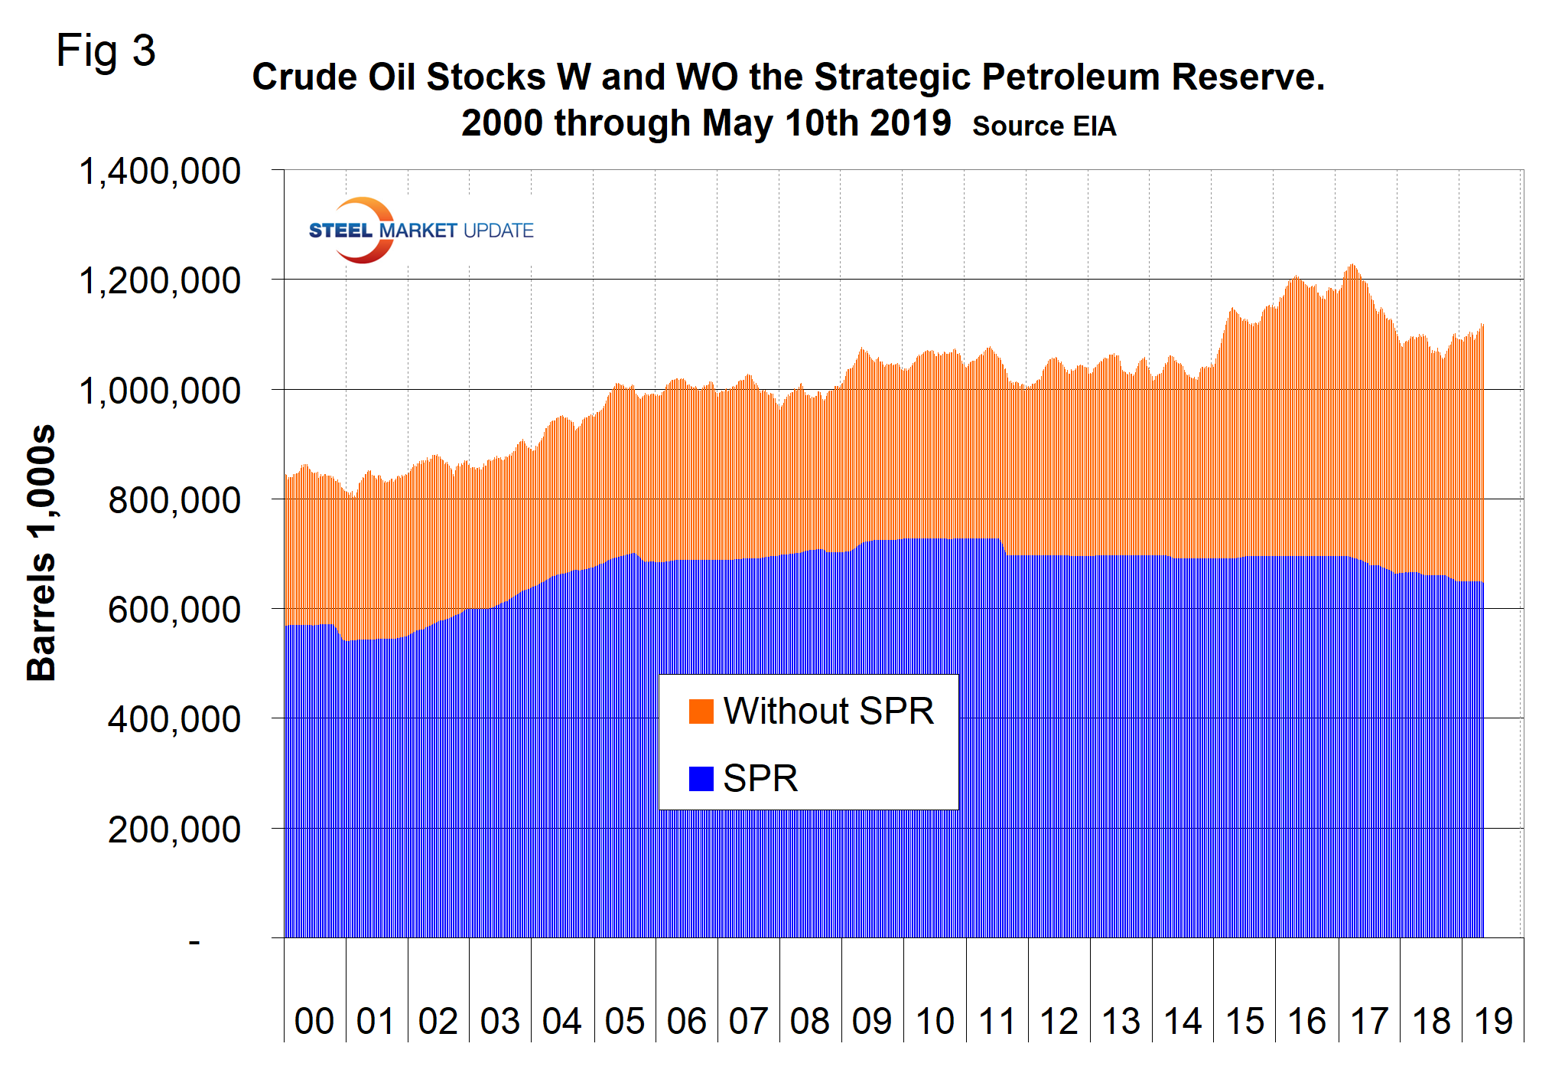
Figure 3 breaks total crude inventory into the working portion and the strategic petroleum reserve.
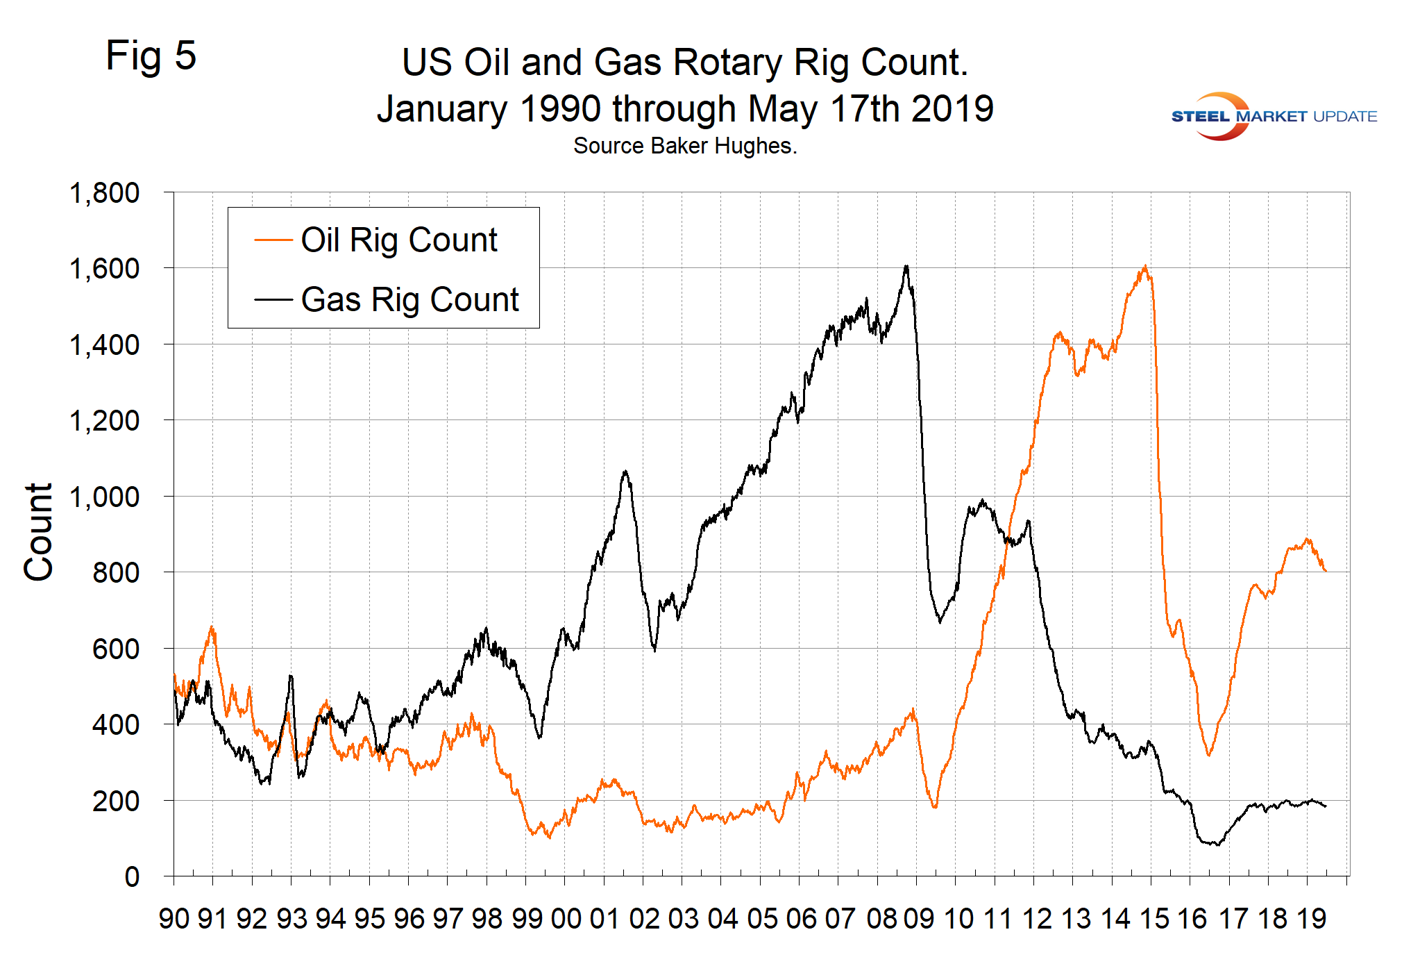
The total number of operating rigs in the U.S. on May 17 was 997, which was down by 88 since Jan. 4. Oil rigs were down by 75 and gas by 13. Figure 4 shows the total number of operating rigs in the U.S. and the weekly change.
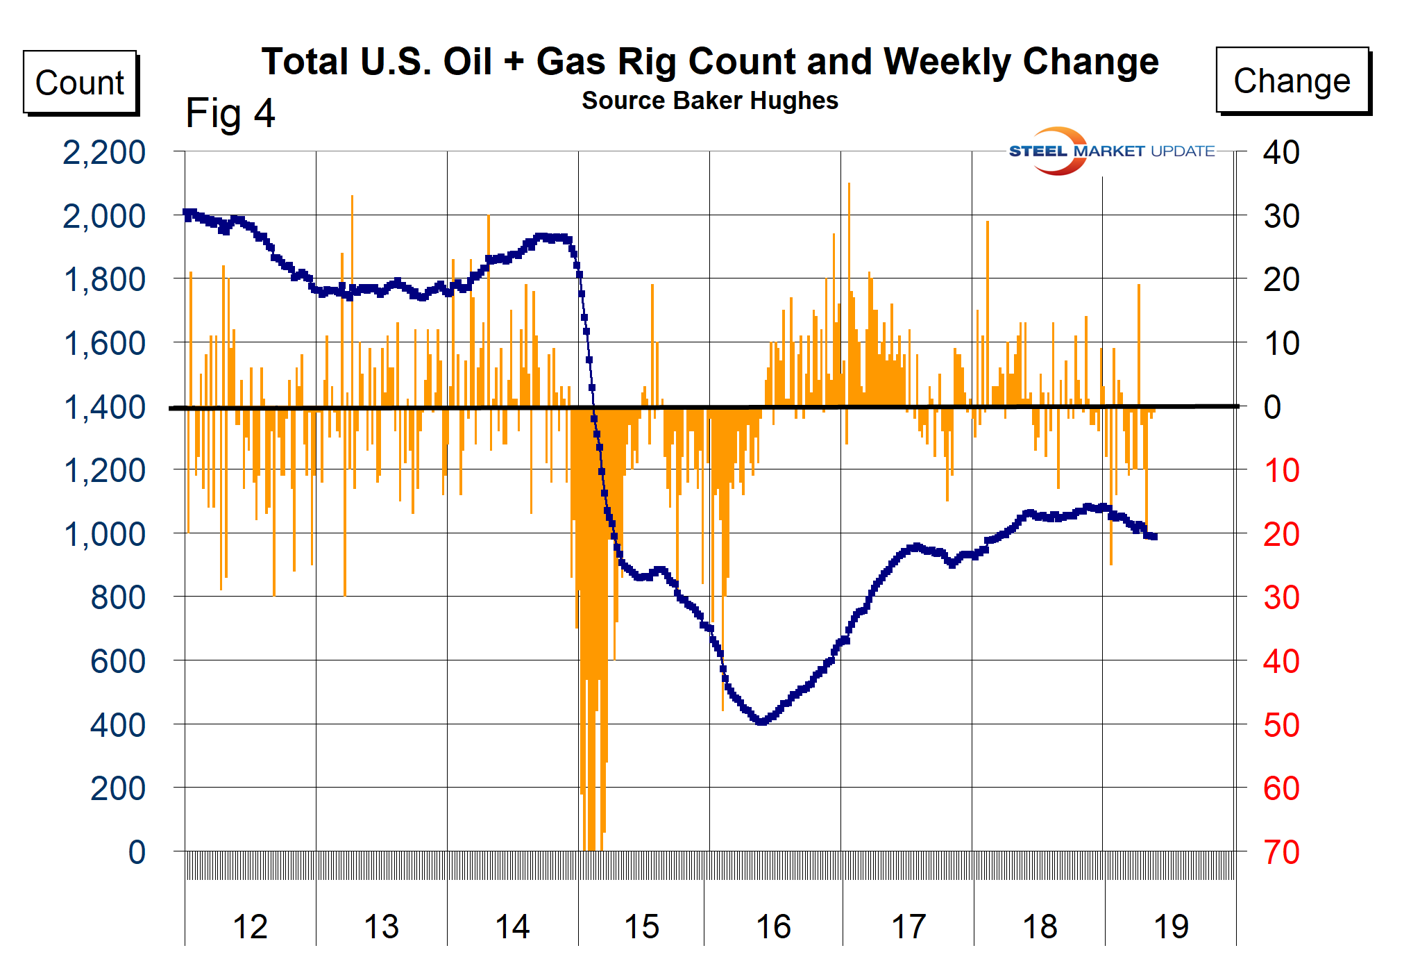
The oil rig count had a low point of 316 on June 27, 2016, and stood at 802 on May 17, 2019.
The U.S. gas rig count rose from its low point of 81 on Aug. 5, 2016, to 185 on May 17, 2019. The year-over-year growth rate of total U.S. operating rigs was negative 5.6 percent in the latest data with oil down by 5.0 percent and gas down by 7.5 percent. Figure 5 shows the Baker Hughes U.S. Rotary Rig Counts for oil and gas equipment in the U.S. (explanation below).
On a regional basis in the U.S., the big three states for operating rigs are Texas, Oklahoma and North Dakota. Figure 6 shows the land rig count in those states since 2000.
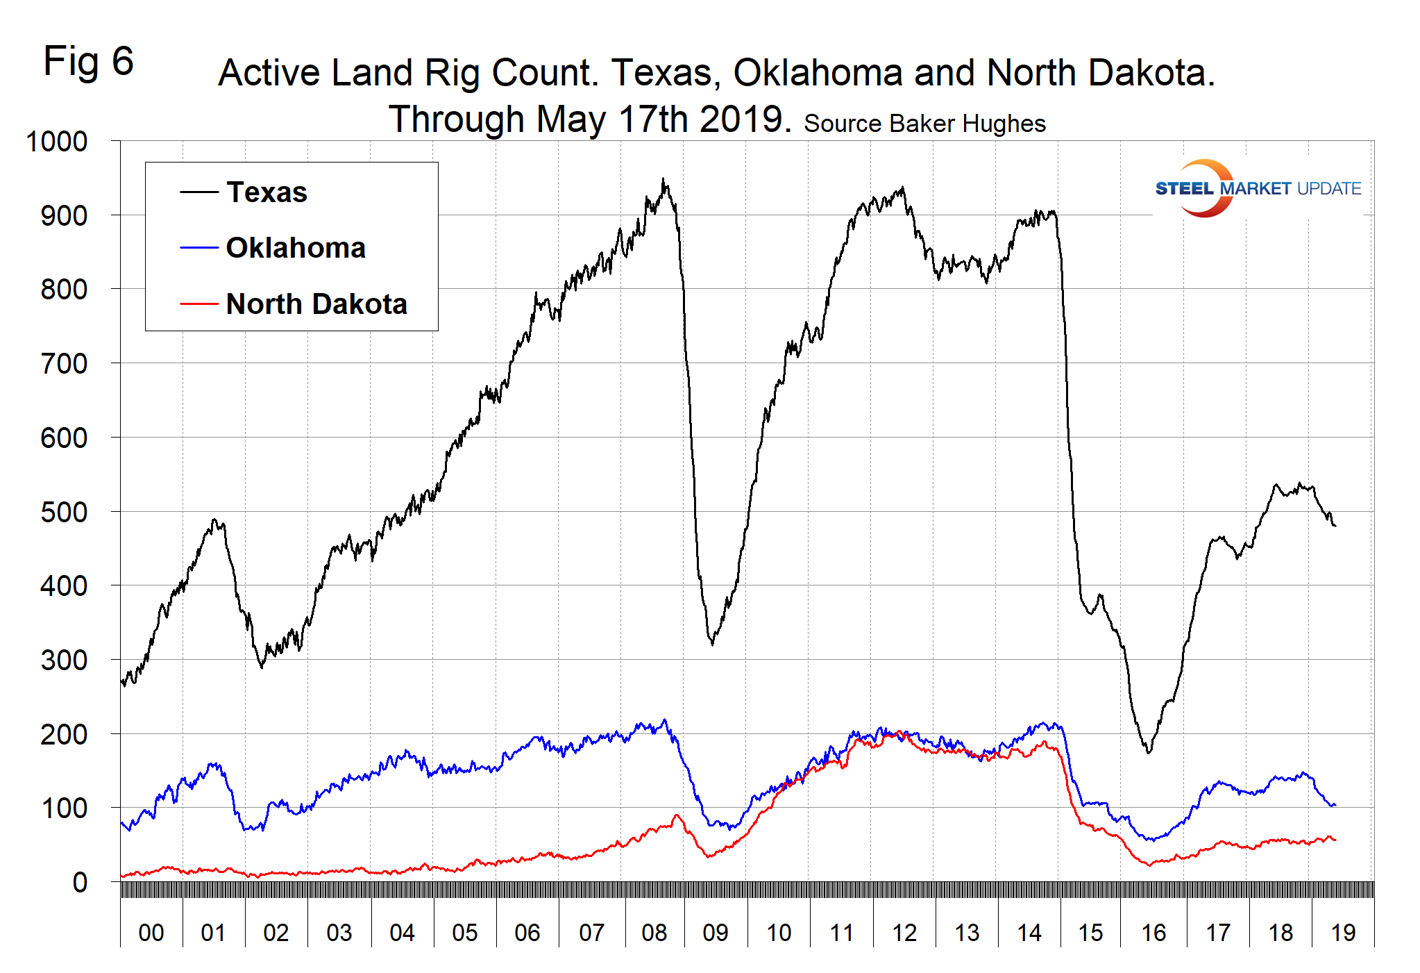
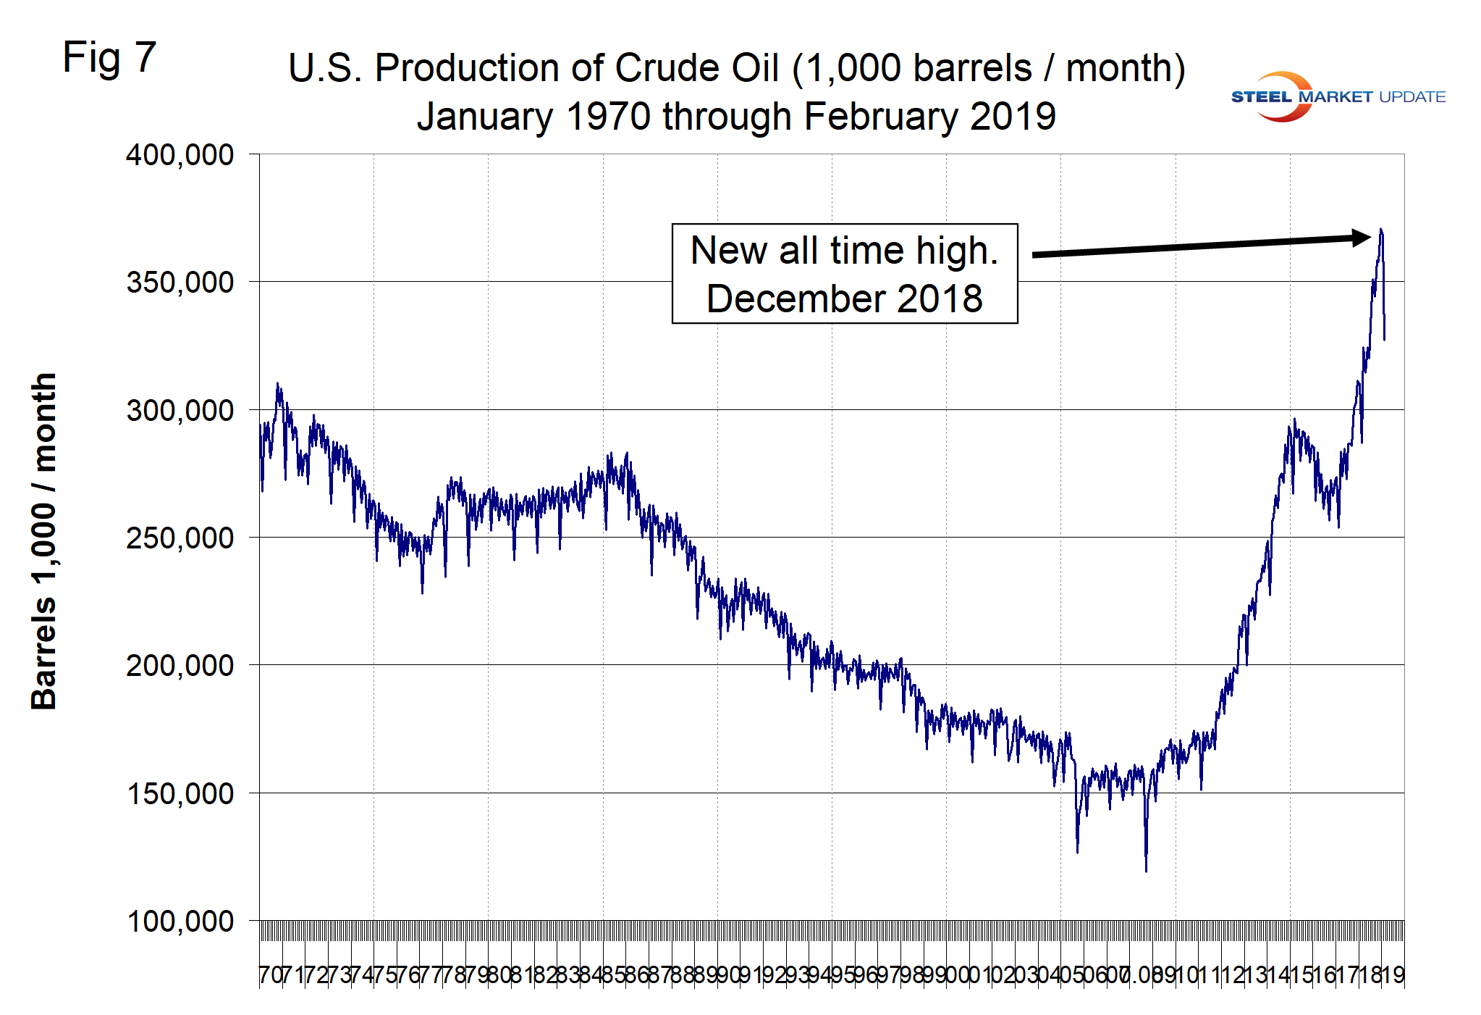
Figure 7 illustrates the monthly U.S. oilfield production of crude from January 1970 through February 2019 (latest data available) in thousands of barrels per month. The historical high was October 1970 at 310.4 million barrels. Production steadily declined to half that level in the late 2000s before the fracking revolution. December 2017 broke the record that had stood for 47 years with 310.7 million barrels produced and December 2018 set a new record at 370.8 million barrels. February 2019 saw a sharp decline to 327 million barrels.
U.S. exports of total petroleum products set a record high in 2018, reaching an annual average of 5.6 million barrels per day (b/d), an increase of 366,000 b/d from 2017 levels. The three largest petroleum product exports from the United States in 2018 were distillate, propane and motor gasoline. U.S. exports of motor gasoline (including blending components) and propane reached record highs in 2018, and exports of distillate reached their second-highest volume on record, following the high set in 2017.
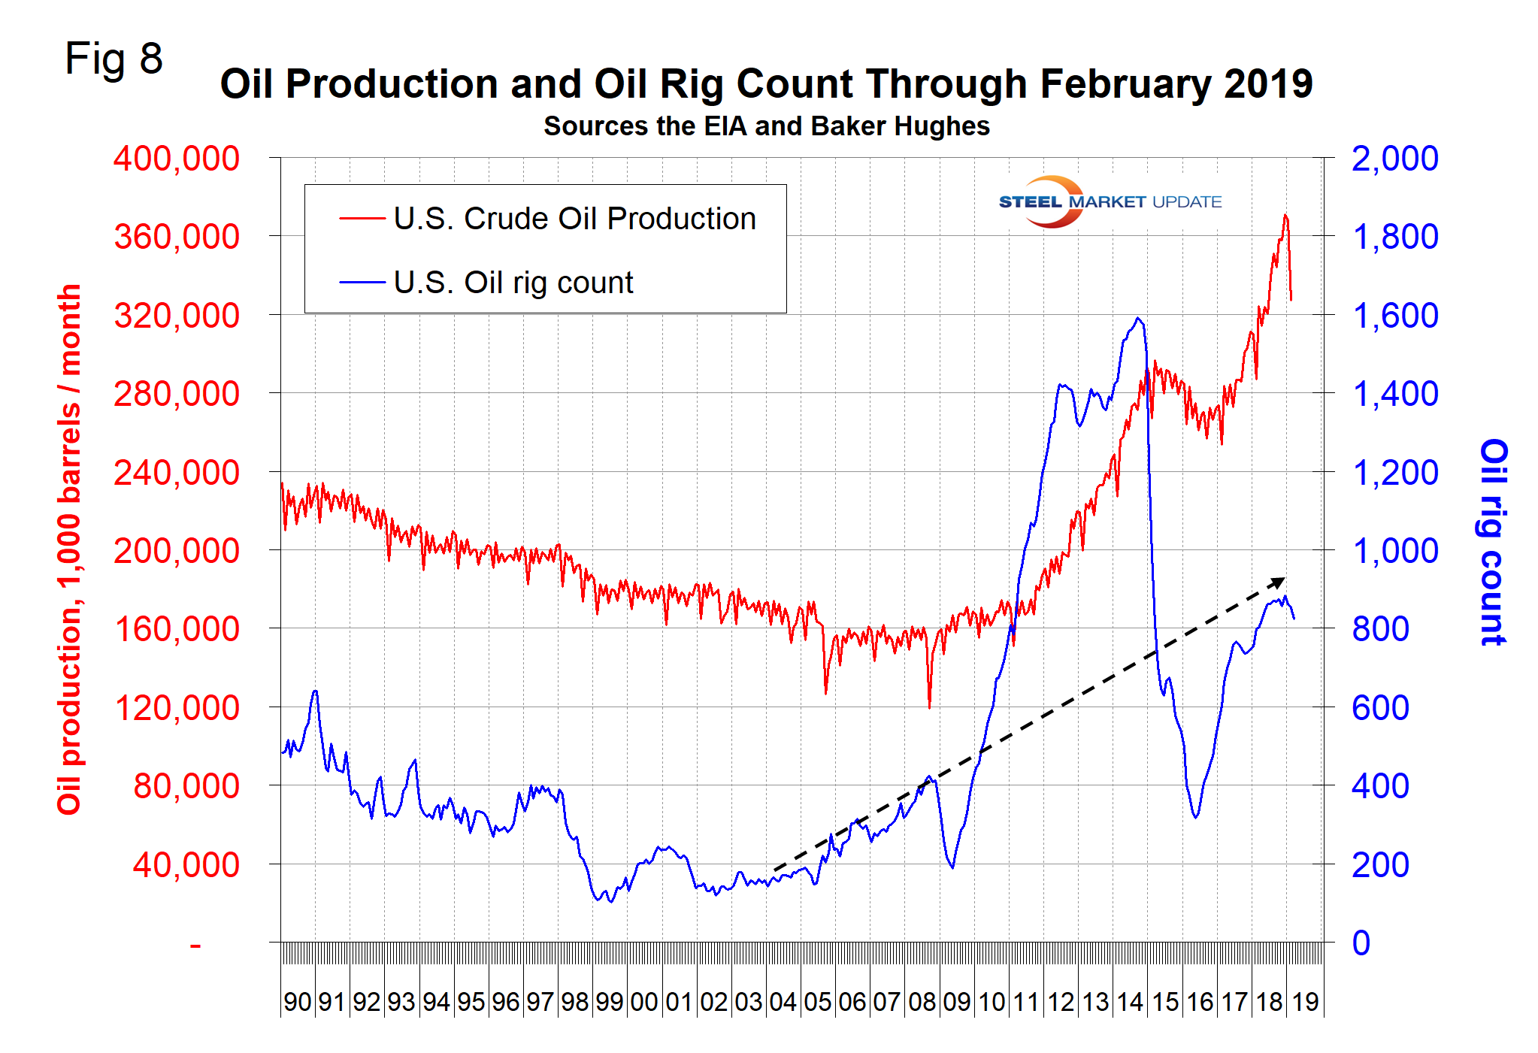
Figure 8 compares oil production and the oil rig count and shows how the increase in exploratory wells drove production from 2009 through late 2014 when the oil price collapsed. Rig count and production have declined synchronously in 2019.
Baker Hughes Rotary Rig Count: This is a weekly census of the number of drilling rigs actively exploring for or developing oil or natural gas in the United States. Rigs are considered active from the time they break ground until the time they reach their target depth and may be establishing a new well or sidetracking an existing one. The Baker Hughes Rotary Rig count includes only those rigs that are significant consumers of oilfield services and supplies.


