

Market Data

July 18, 2019
Manufacturing Update: Still Positive, But Growth Slowing
Written by Peter Wright
Most indicators of manufacturing activity are still positive, but if trends continue, growth will become negative by late summer.
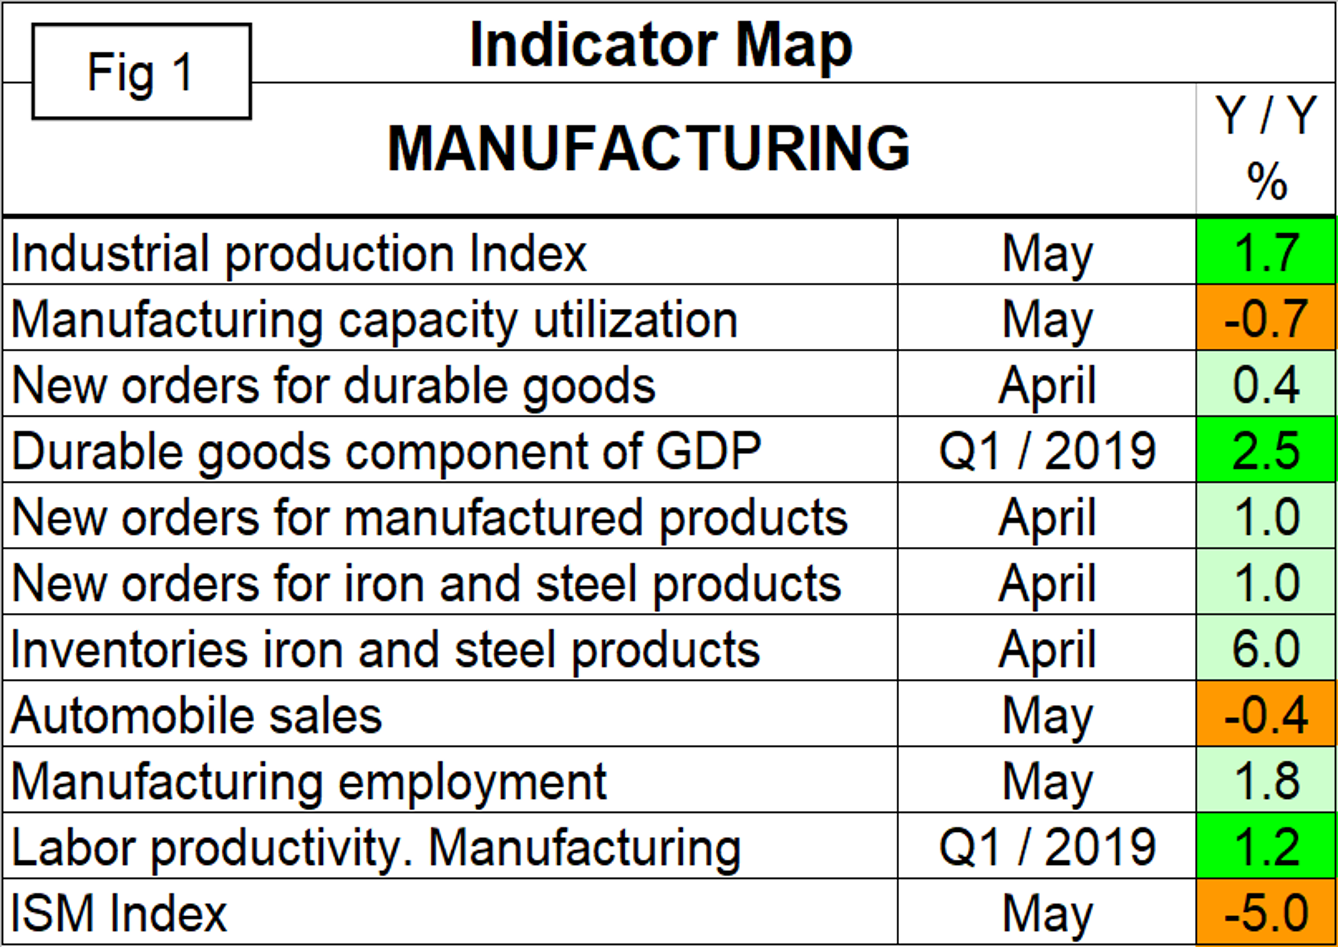
This report summarizes 11 data streams that describe the state of U.S. manufacturing in general and the steel industry in particular. We have reported on most of these separately in our Steel Market Update publications, and therefore will be brief in this summary. We don’t expect these data sources to all point in the same direction. Our intent in summarizing them in one document is to provide a consensus of the state of this critical steel consuming sector. In the latest data the growth rate of six of the 11 data streams are pointing down. Based on American Iron and Steel Institute estimates of steel mill shipments by market classification, almost 50 percent of the steel consumed in the U.S. is manufacturing-oriented. This breaks down to about 27 percent in ground transportation, 9 percent in machinery and equipment, 5 percent in appliances, 4 percent in defense and about 4 percent in containers.
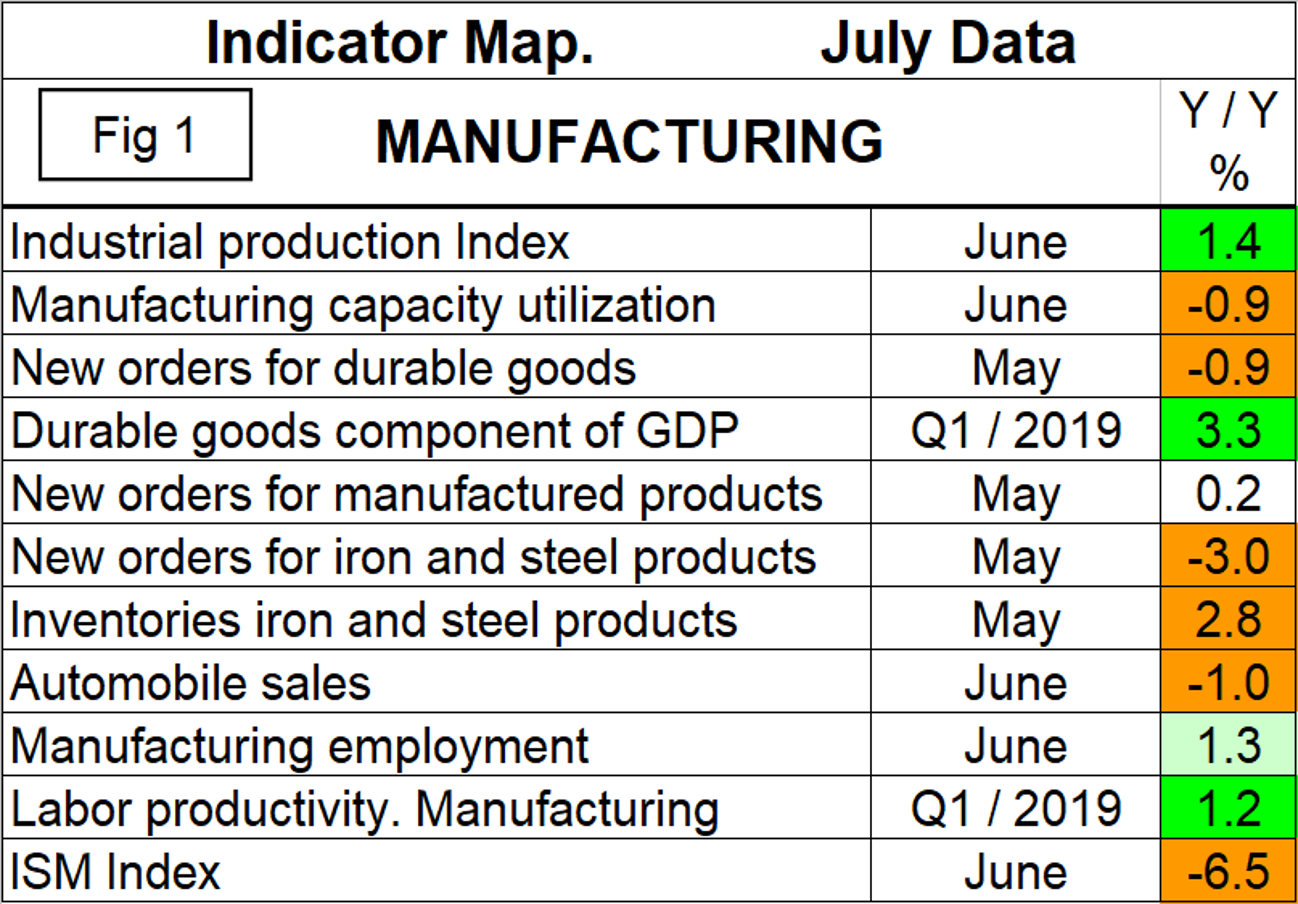
This month we have included two versions of Figure 1, which summarize the 11 individual data streams. The first is for data released in June and the second is July data. There has been a significant deterioration in one month.
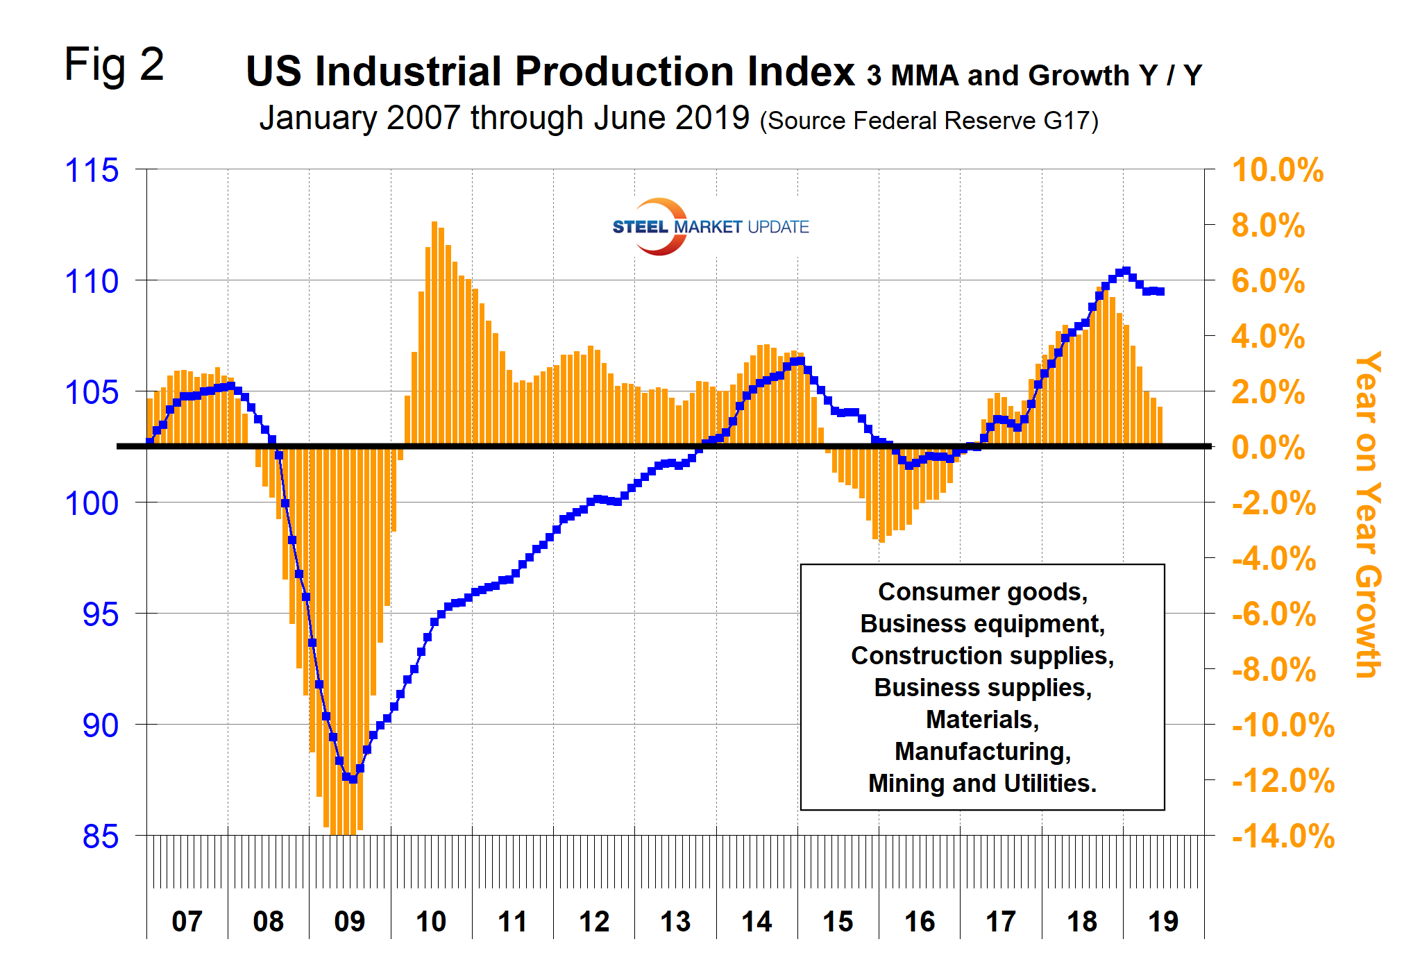
The Industrial Production Index
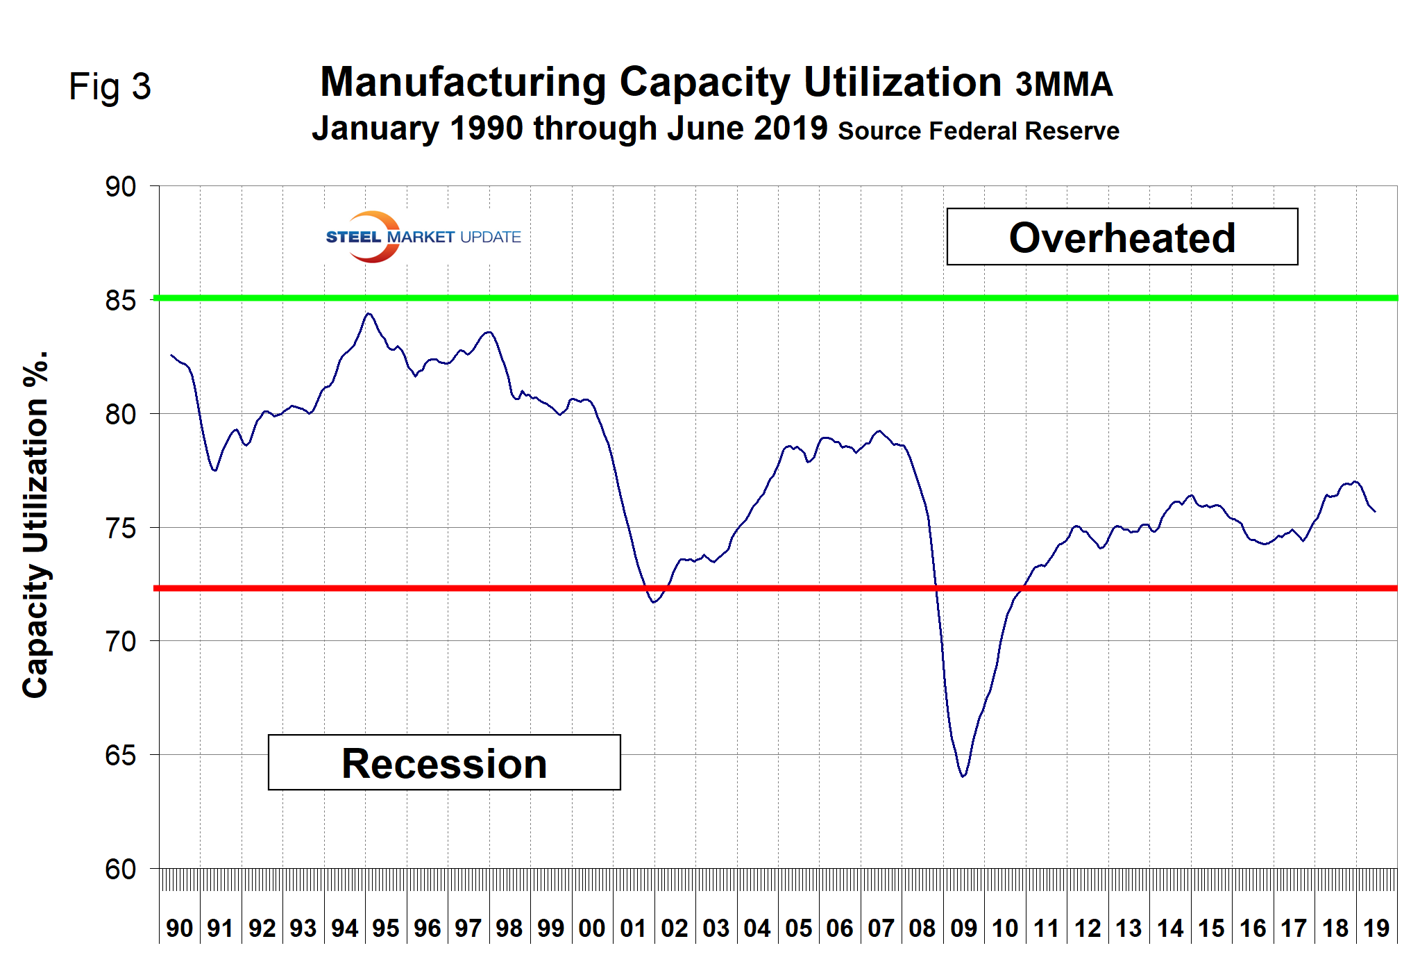
Figure 2 shows the three-month moving average (3MMA) of the IP index since January 2007 as the blue line and the year-over-year growth as the brown bars. March 2017 was the first month of positive growth in the 3MMA since April 2015. Year-over-year growth peaked at 5.8 percent in October of last year and has contracted every month since then reaching 1.4 percent in June. Manufacturing capacity utilization improved from 74.48 percent in January 2017 to 77.01 percent in December last year and has declined every month in 2019 reaching 75.7 percent in June with a negative year-over-year growth rate of 0.9 percent on a 3MMA basis (Figure 3).
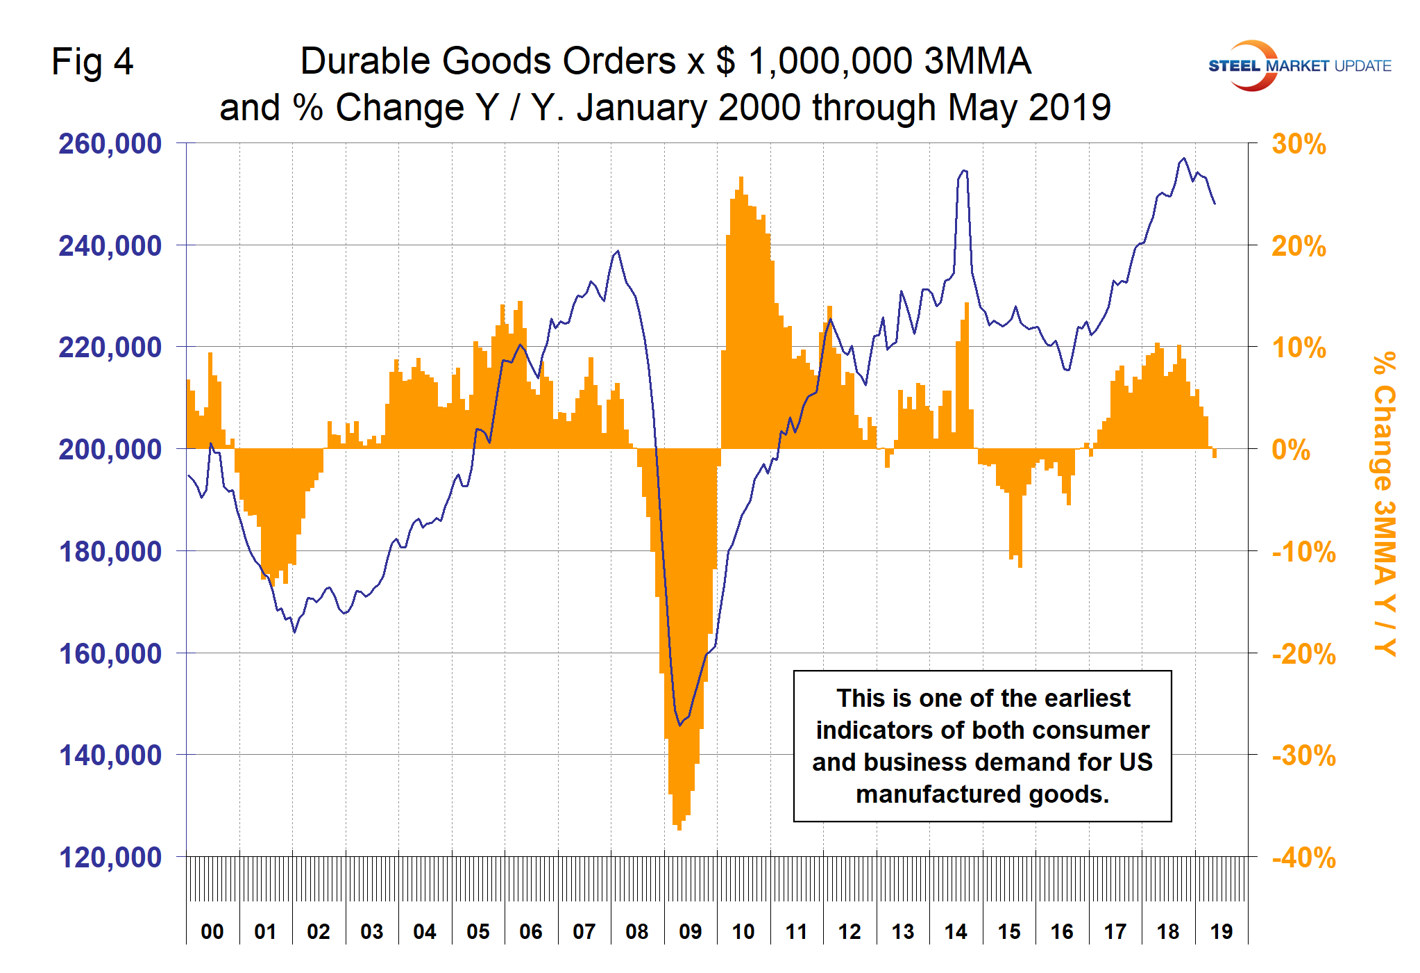
New Orders for Durable Goods, (Advance Report)
The year-over-year growth rate of durable goods reached 9.7 percent in September last year and since then has declined to negative 0.9 percent in May. Figure 4 shows the 3MMA since January 2010. This is considered to be one of the earliest indicators of both consumer and business demand for U.S. manufactured goods.
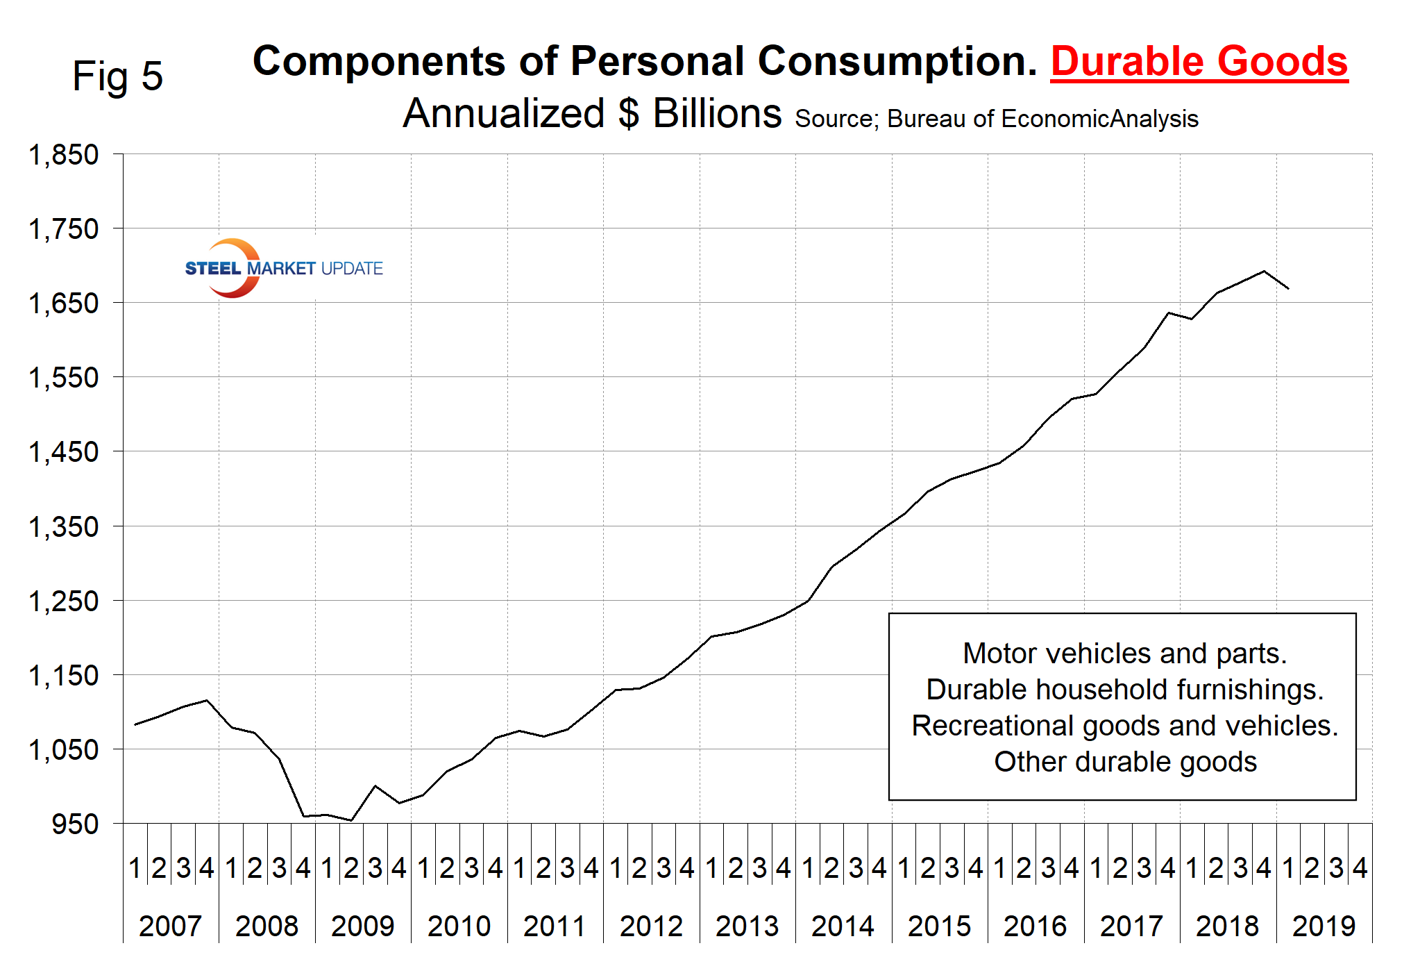
The Durable Goods Portion of GDP
The third estimate of Q1 2019 GDP growth was reported as 3.1 percent annualized, which was up from 2.2 percent in Q4 2018. A subcomponent of the quarterly data is durable goods, which is part of the personal consumption calculation. It therefore contains no military hardware or civil aircraft data. This is shown in Figure 5 and, presumably because of the exclusions just mentioned, looks nothing like the blue line in Figure 4. The durable goods portion of GDP declined from $1.692 trillion (annualized) in Q4 2018 to $1.682 trillion in Q1 2019.
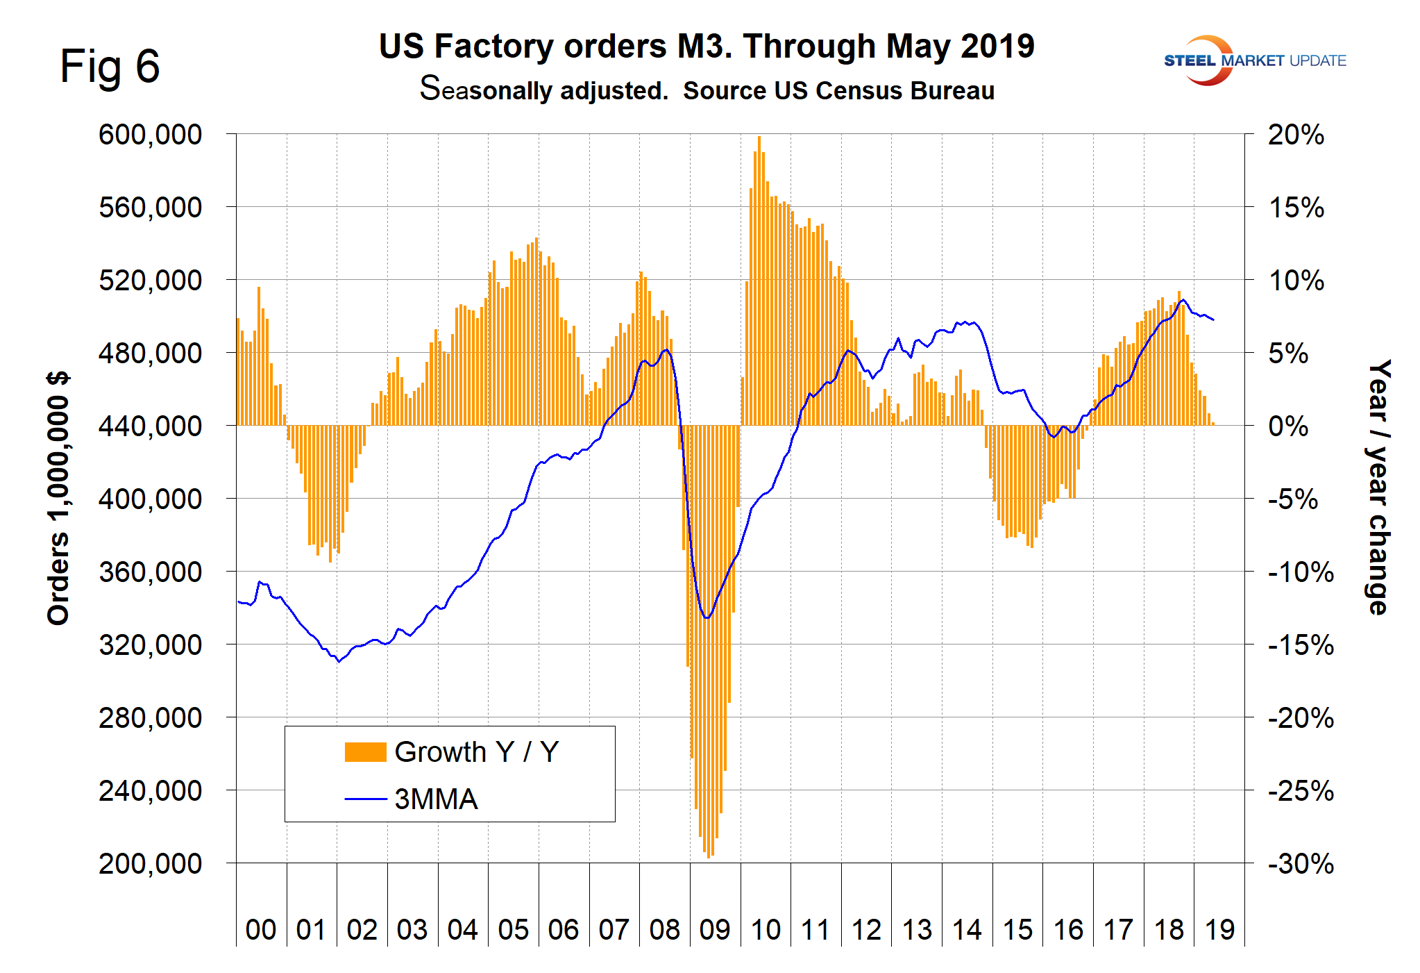
New Orders for Manufactured Products
New orders for manufactured products as reported by the Census Bureau declined every month October through May on a 3MMA basis. In May, the year -over-year growth was 0.2 percent, down from 9.2 percent in September (Figure 6).
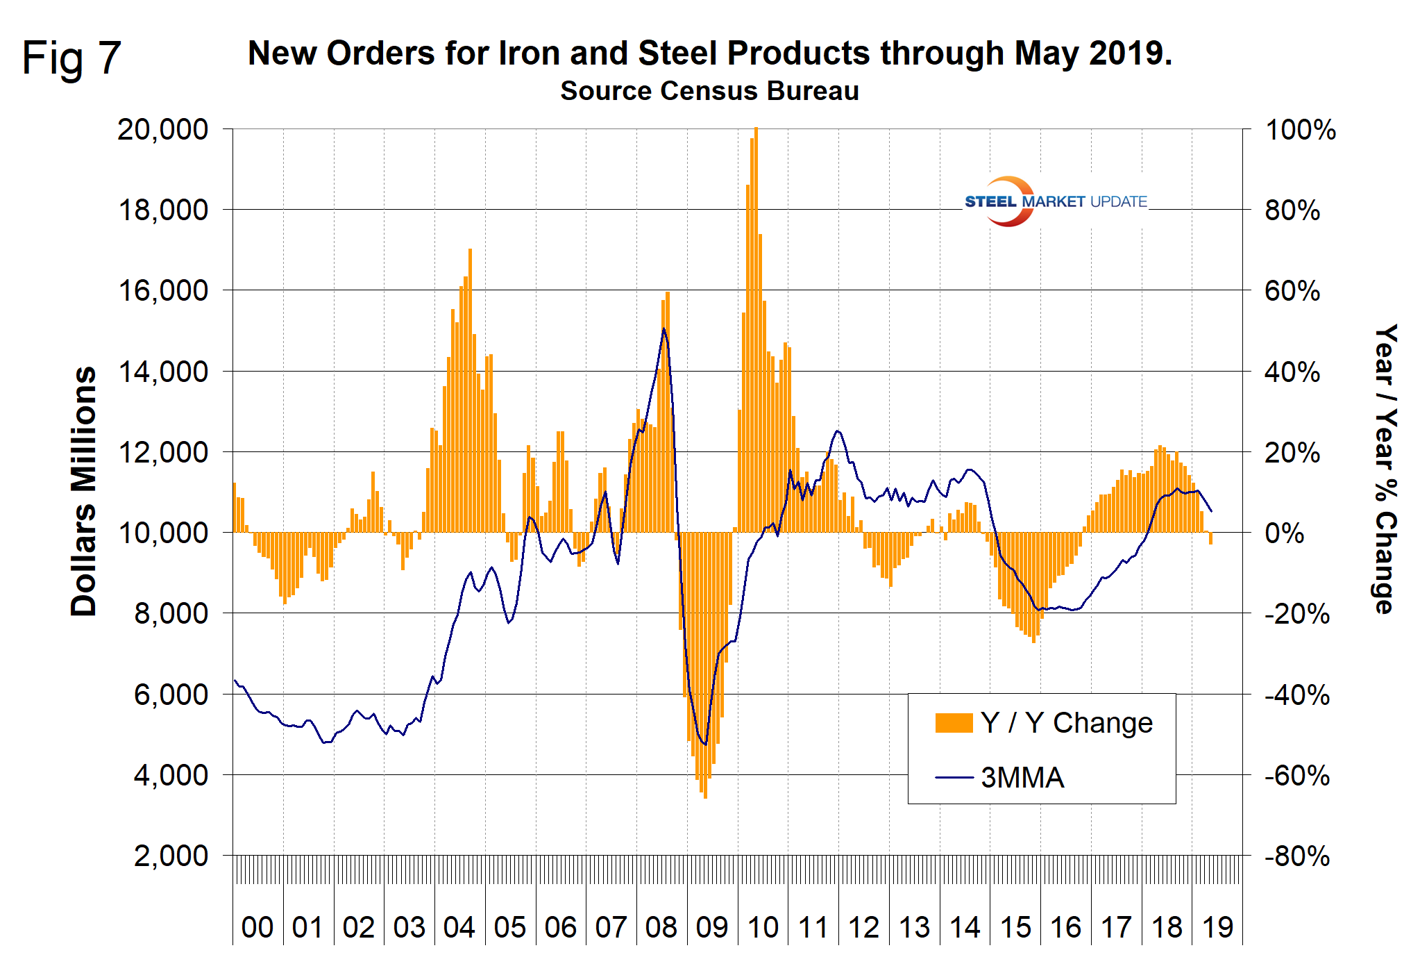
New Orders for Products Manufactured from Iron and Steel
Within the Census Bureau M3 manufacturing survey is a subsection for new orders for Iron and Steel products. Figure 7 shows the history since January 2000. The year-over-year growth rate has declined from 21.6 percent in March last year to negative 3.0 percent in May 2019. Growth has declined every month since last September.
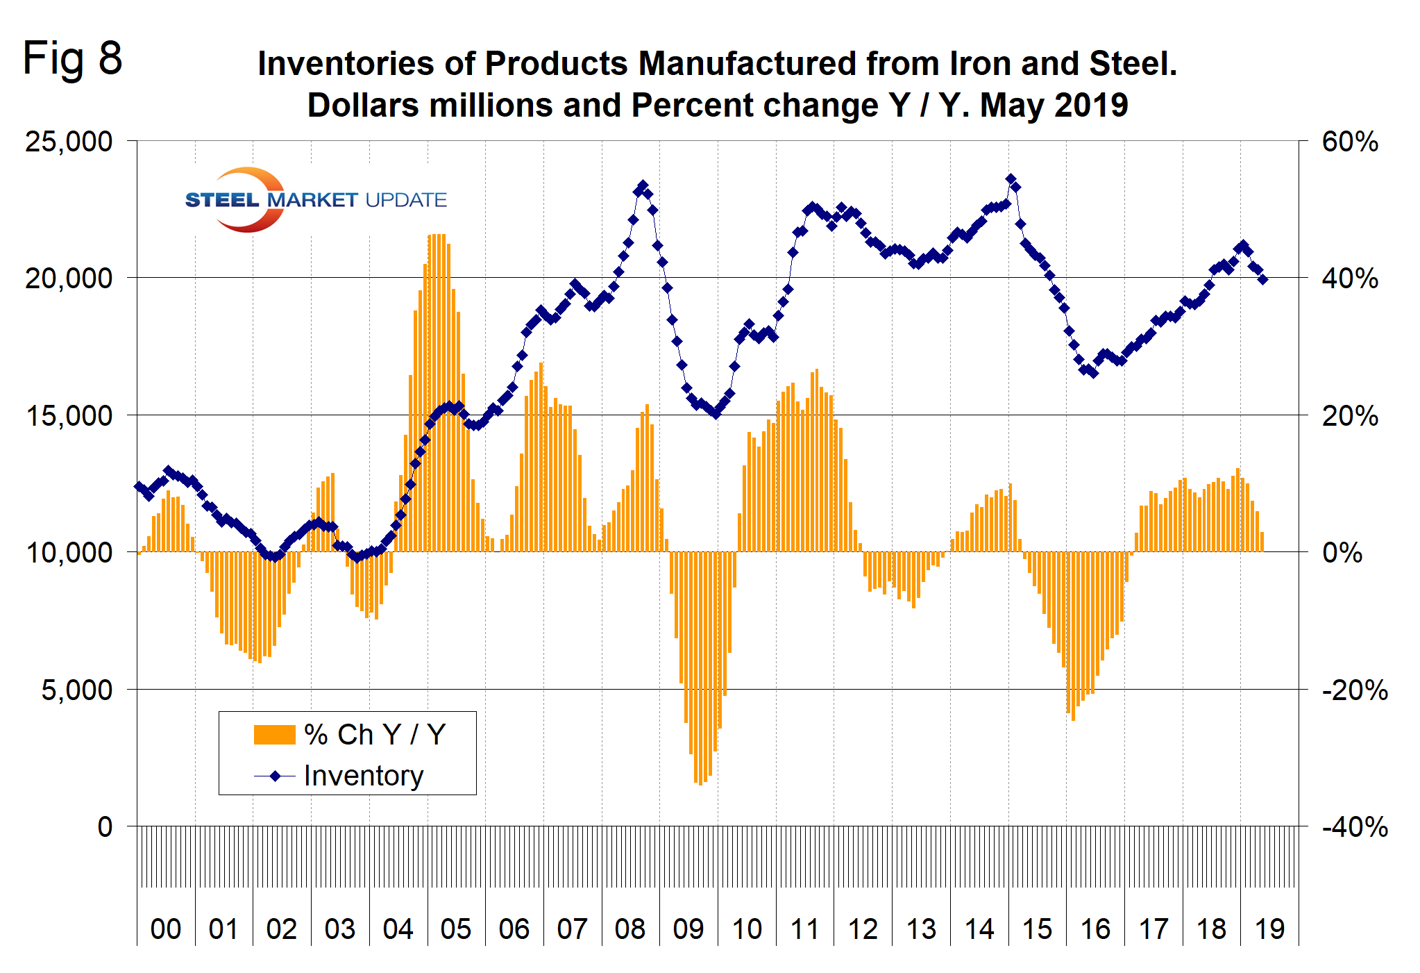
Inventories of Products Manufactured from Iron and Steel
The inventory build was at a rate of 12.2 percent year over year in December and fell every month through May when it was 2.8 percent (Figure 8). Inventories were down by less than new orders, therefore we classified this as a negative in Figure 1.
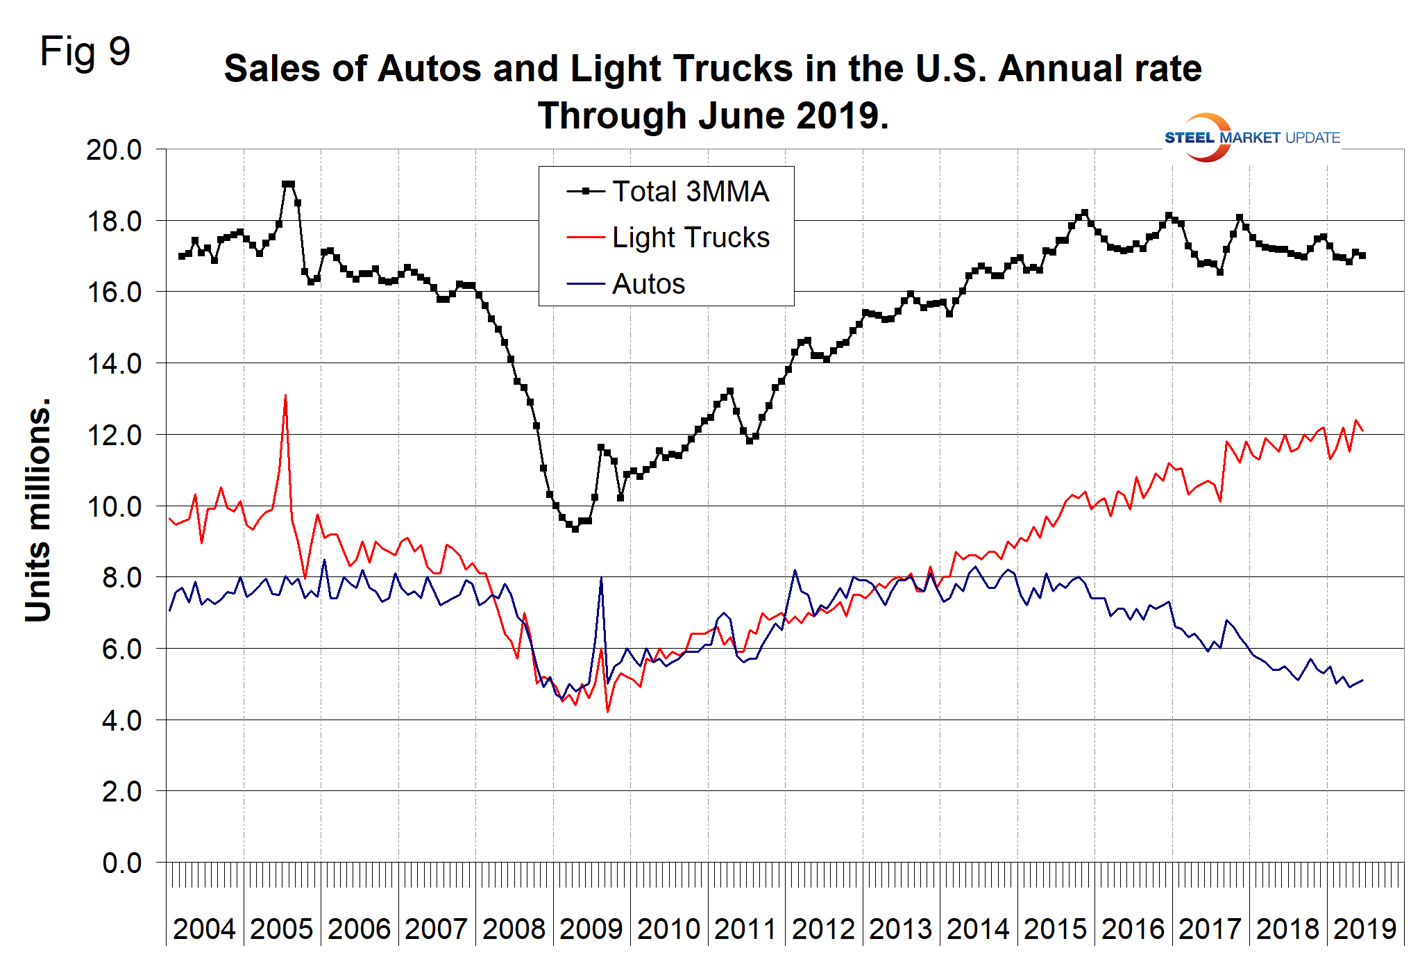
Light Vehicle Sales in the U.S
Automobile sales have trended down slightly in the last three years as measured by the cyclical peaks. Year over year on a 3MMA basis, sales were down by 1.0 percent in June totaling 17.2 million units annualized and were comprised of 70.3 percent light trucks and 29.7 percent autos. The declining sale of autos in the last three years has resulted in GM announcing its intent to close several small car plants. The light truck category includes SUVs and crossovers. Overall, sales are still higher than the pre-recession level (Figure 9). Import market share in June was 23.3 percent and has been drifting up since September 2015.
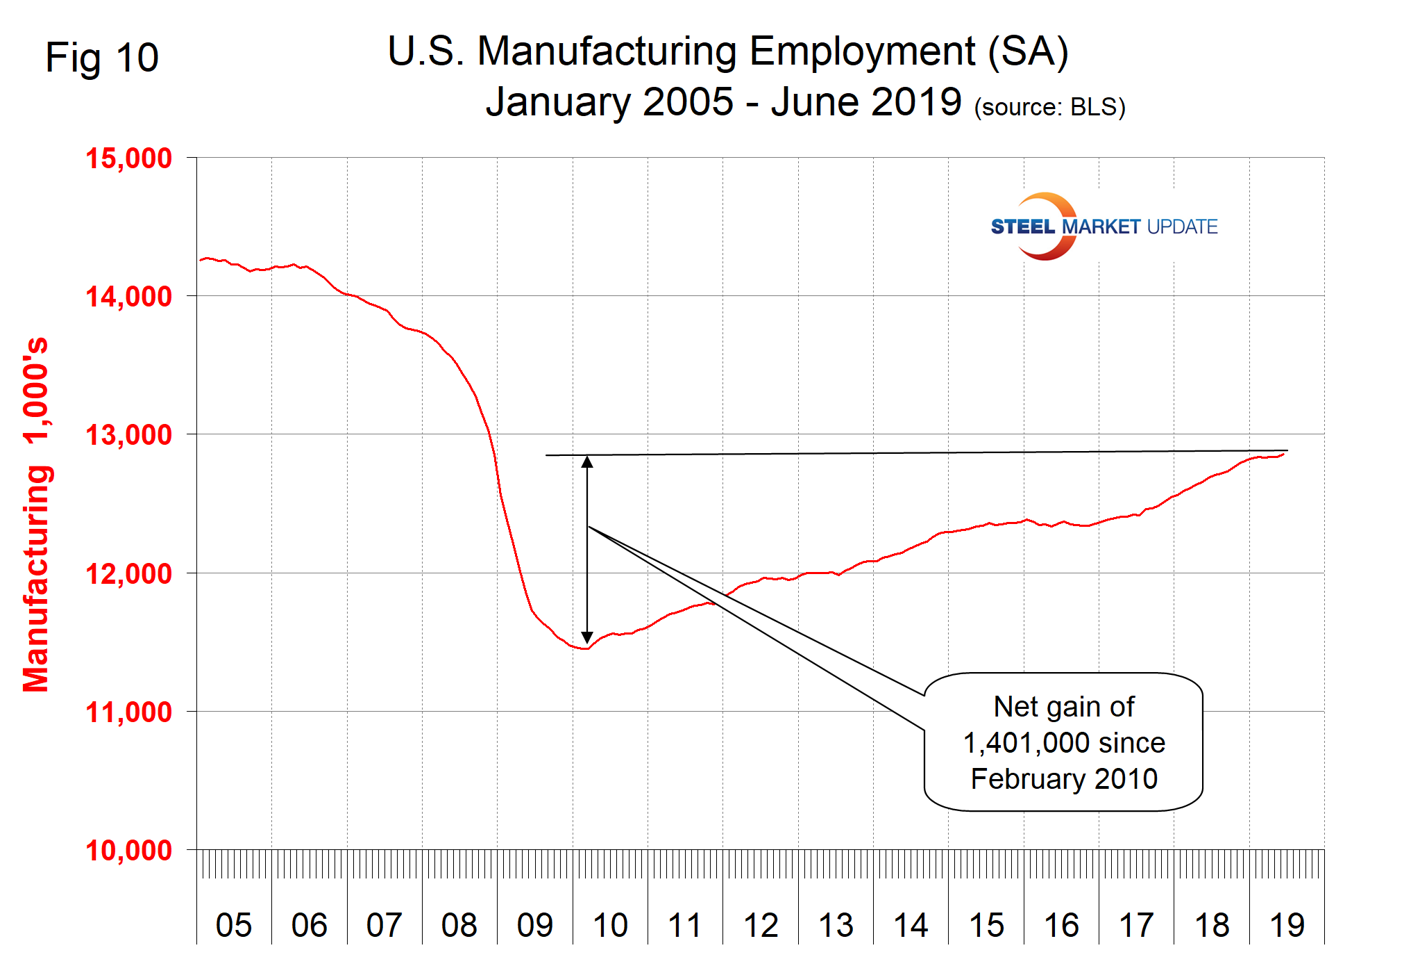
Manufacturing Employment
Manufacturing employment plummeted during the recession and gradually improved from the spring of 2010 through 2014. Growth was flat in 2015 and declined slightly in 2016 when 23,000 jobs were lost during the year as a whole. There was a turnaround in 2017 and in the 12 months of 2018, 264,000 jobs were created. In the first five months of 2019, 45,000 manufacturing jobs were created (Figure 10). The motor vehicles and parts subcomponent of manufacturing employment had a net loss of 7,000 jobs in the first five months of 2019.
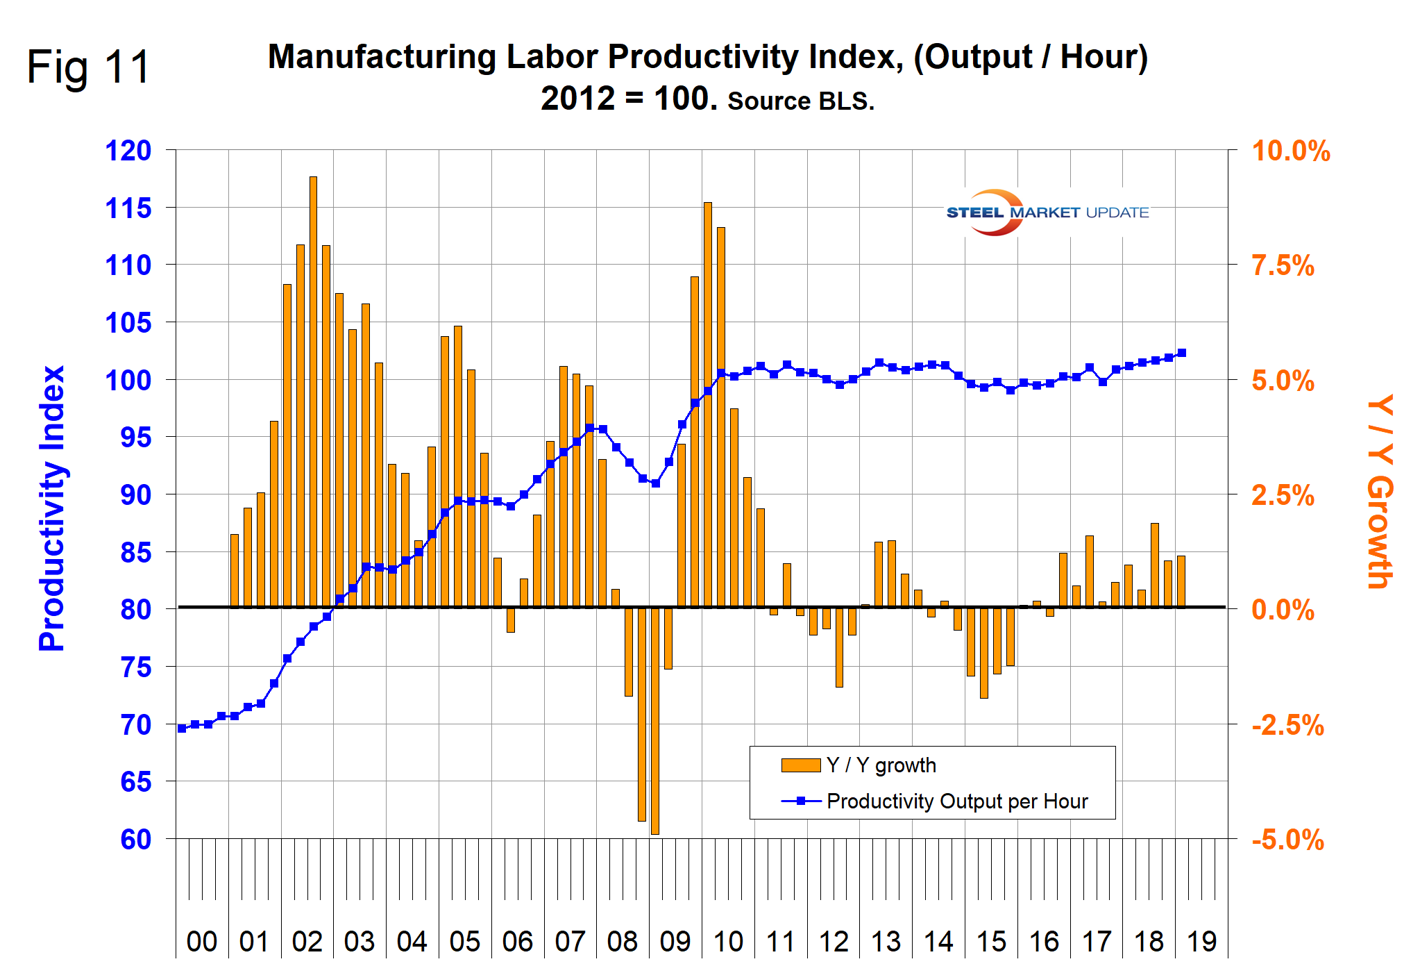
Manufacturing Productivity
The Bureau of Labor Statistics reported that in Q1 2019 manufacturing productivity completed three back-to-back quarters of growth over 1.0 percent, the best performance since 2010 (Figure 11).
The ISM Manufacturing Index
The Institute for Supply Management’s Manufacturing Index is a diffusion index. ISM states: “Diffusion indexes have the properties of leading indicators and are convenient summary measures showing the prevailing direction of change and the scope of change. An index value above 50 indicates that the manufacturing economy is generally expanding; below 50 indicates the opposite.” Figure 12 shows the 3MMA of the ISM index from January 1997 through June 2019. The index surged from January 2016 through October 2017, leveled off through October 2018 and has declined since then. The index had a value of 51.7 in June with a 3MMA of 52.2, down by 6.5 points year over year.
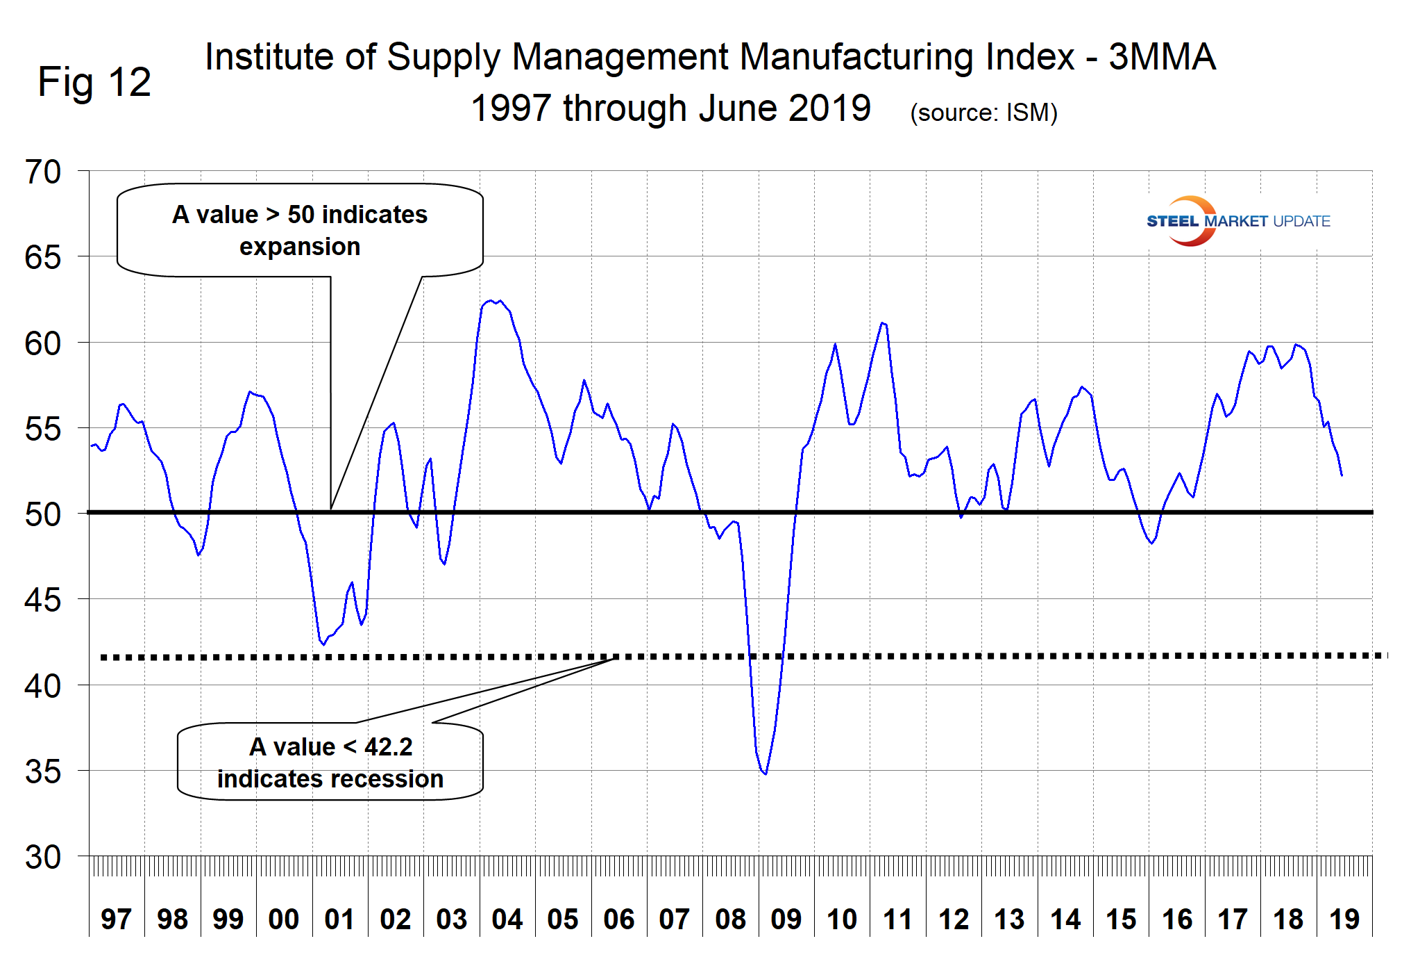
SMU Comment: Manufacturing is still experiencing positive growth, but the indications are clear that if present trends continue growth will become negative within the next few months. The only encouraging current data point is the improvement in manufacturing labor productivity, but this may be driven by a management squeeze in the face of declining orders. The ISM index is still signaling growth, but if the trend continues it will reverse by late summer.


