

Market Data
October 10, 2019
Census Bureau Data Confirms Slowing Steel Shipments in 2019
Written by Peter Wright
Census Bureau data confirms a slowdown in steel product shipments and new orders in 2019.
Steel industry trade association data from the American Iron and Steel Institute (AISI) and the Metals Service Center Institute (MSCI) are most widely used to assess the state of the industry. In addition, the Census Bureau provides monthly data on manufacturing inventories, shipments and new orders for total U.S. manufacturing and for individual industries, one of which is steel products. Therefore, the Census Bureau provides a useful reality check for association data.
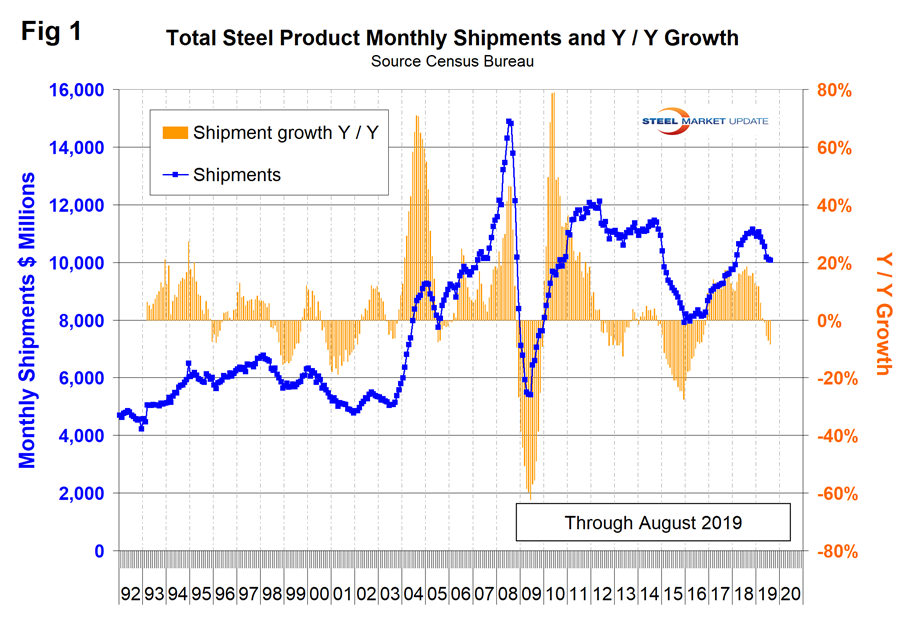
Total shipments and inventories are reported in millions of dollars, seasonally adjusted. Year over year through August, steel product shipment growth had declined to negative 8.4 percent and new orders growth was negative 6.1 percent.
Census Bureau results for August were released on Oct. 4. Figure 1 shows monthly steel product shipments in millions of dollars since 1992 with the year-over-year growth. Shipments peaked last November and have since declined every month. The year-over-year growth rate has declined from 18.6 percent in August last year to negative 8.4 percent in August 2019.
The Census Bureau defines shipments as follows: “Manufacturers’ shipments measure the dollar value of products sold by manufacturing establishments and are based on net selling values, f.o.b. (free on board) plant, after discounts and allowances are excluded. Freight charges and excise taxes are excluded. Multi-industry companies report value information for each industry category as if it were a separate economic unit. Thus, products transferred from one plant to another are valued at their full economic value.”
In our SMU reports, we aim to provide information on the same subject from different sources. The data in Figure 1 compares well with the AISI weekly crude steel production shown in Figure 2. One is in dollars and the other in tons, but the shape of the curves is comparable.
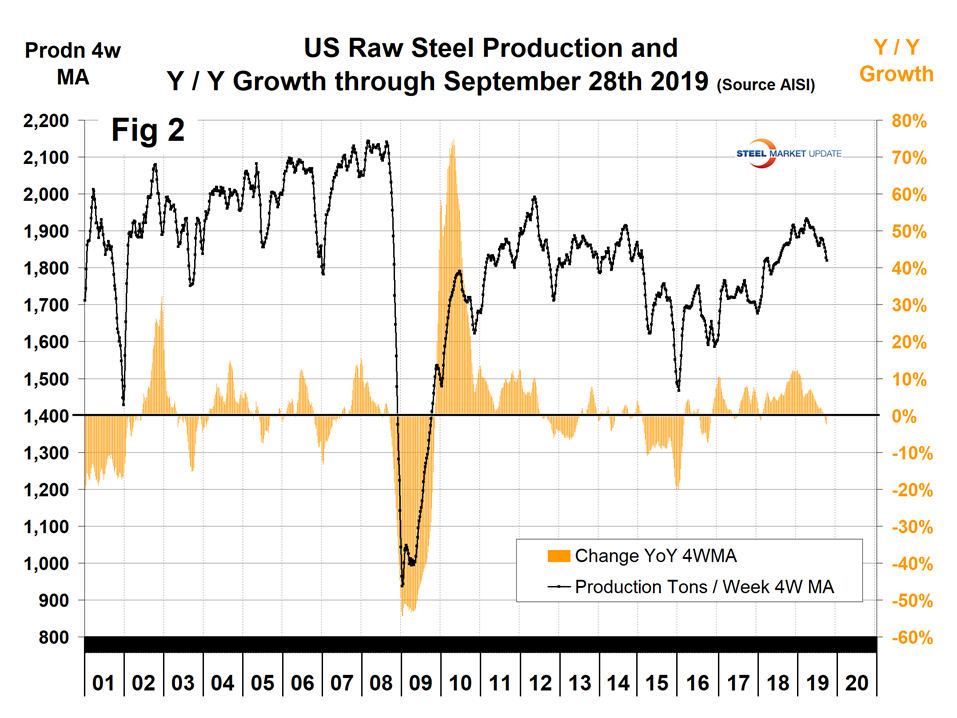
Figure 3 shows shipments and new orders on a monthly basis for all steel products since 2010. An encouraging sign is that new orders exceeded shipments in July and August.
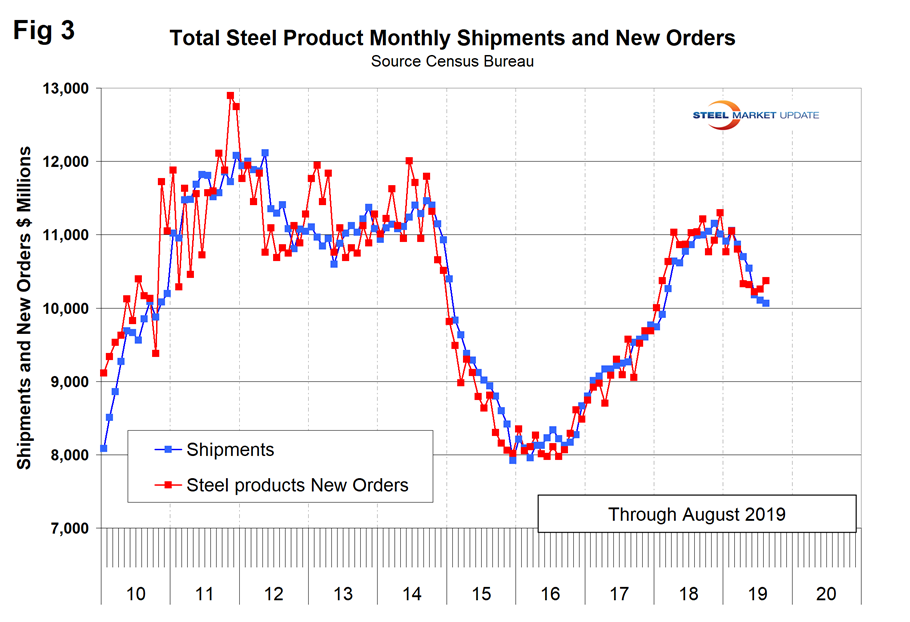
Figure 4 shows the same total shipment line as Figure 1, but now includes the inventory-to-shipment ratio. The IS ratio has been increasing for over a year, but in July and August there was a small turnaround.
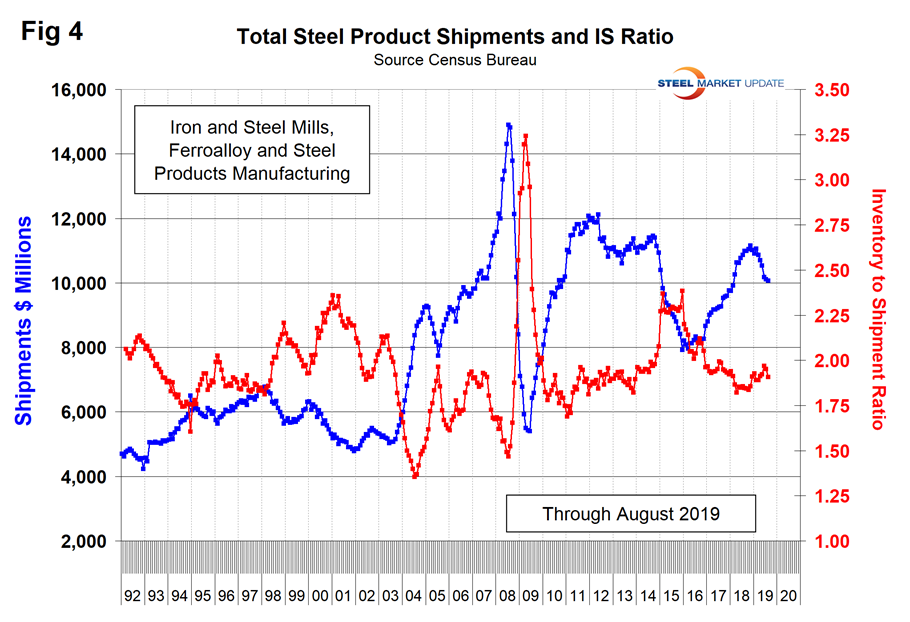
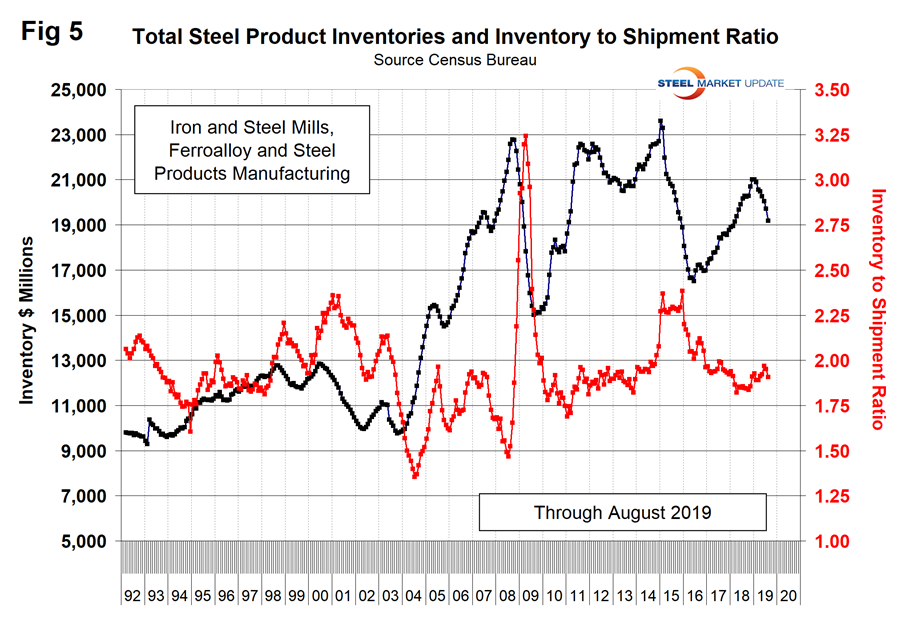
Figure 5 shows total inventory in millions of dollars and repeats the inventory-to-shipment ratio shown in Figure 4. Inventories have declined in parallel with shipments.
SMU Comment: Data from the Census Bureau for steel product orders, shipments and inventories shows a slowing market in 2019, which aligns with AISI data for weekly steel production. Therefore, our reality check is good.


