

Market Data

October 27, 2019
Steel Mill Lead Times: Still Getting Shorter
Written by Tim Triplett
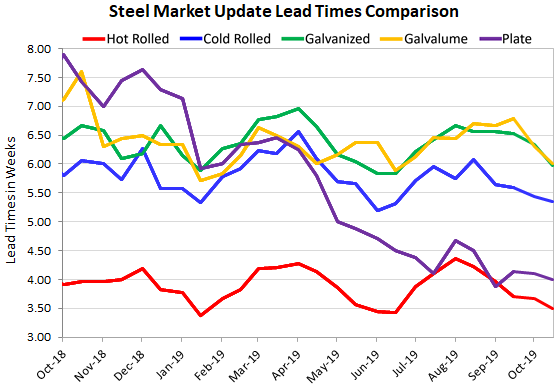
Mill lead times for flat rolled products continued to shorten slightly over the past few weeks. The average lead time for hot rolled is now down to three and a half weeks, cold rolled is less than five and a half weeks and coated steels are just six weeks. Plate lead times remain around four weeks, according to data gathered this past week by Steel Market Update. It should be noted, however, that SMU gathered this data prior to the $40 price increase announced by the mills later in the week.
Lead times for steel delivery are a measure of demand at the mill level. The shorter the lead time, the less busy the mills, and the more likely they are to discount prices.
Hot rolled lead times now average 3.50 weeks, shortened from 3.67 weeks in early October. The average cold rolled lead time has dipped to 5.35 weeks from 5.44 weeks. The average lead time for galvanized has shortened to 5.97 from 6.33 weeks, while the lead time for spot orders of Galvalume is down to 6.00 weeks. Lead times for spot orders of plate steel have also declined to an average of 4.00 weeks. All lead times are shorter than they were at this time last year.
“Lead times are a mixed bag with some shorter than normal and others longer,” said one service center executive. “Lead times for cold rolled and coated are fine, but hot rolled is dragging everything down,” added another.
Note: These lead times are based on the average from manufacturers and steel service centers who participated in this week’s SMU market trends analysis. Our lead times do not predict what any individual may get from any specific mill supplier. Look to your mill rep for actual lead times. Our lead times are meant only to identify trends and changes in the marketplace. To see an interactive history of our Steel Mill Lead Times data, visit our website here.


