

Market Data

July 27, 2020
Global Steel Production Through July
Written by Peter Wright
Global steel production contracted by 6 percent year over year in the three months through July as China’s steel production expanded by 6 percent to another all-time high.
This data comes from the World Steel Association (WSA), which defines crude steel as “steel in its first solid (or usable) form: ingots, semi-finished products (billets, blooms, slabs), and liquid steel for castings.”
Figure 1 shows annualized monthly global steel production on a three-month moving average (3MMA) basis and capacity utilization since January 2000 based on the updated OECD capacity data. Capacity utilization in July on a 3MMA) basis was 77.5 percent. On a tons-per-day basis, production in July totaled 4.926 million metric tons, down from June 2019’s all-time high of 5.318 million metric tons.
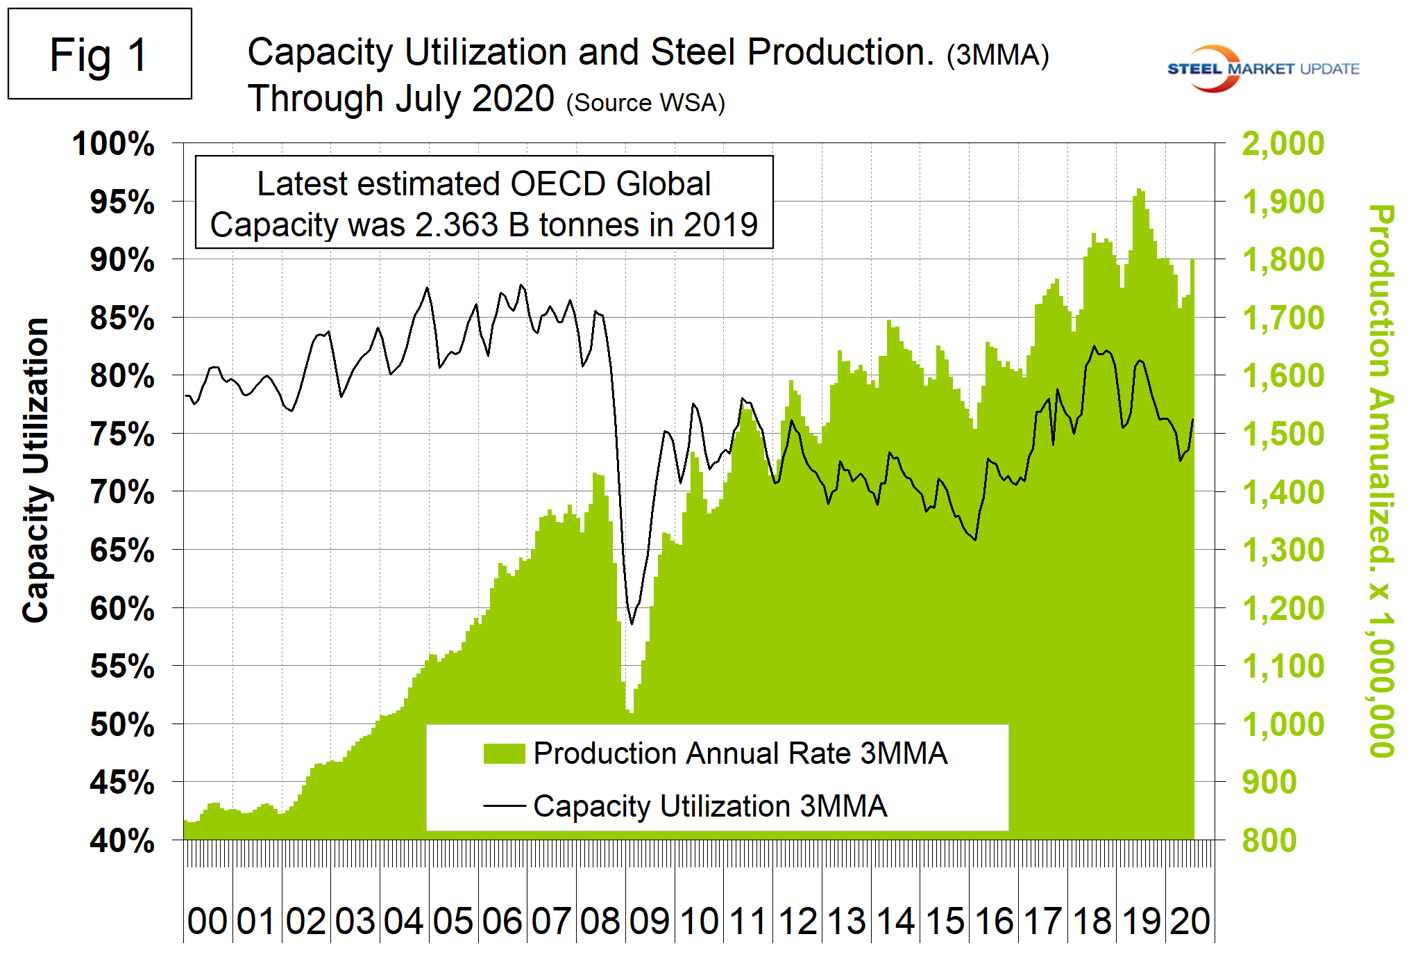
Figure 2 shows the year-over-year growth rate of the 3MMA of global production since January 2013. Growth in three months through July on a year-over-year basis was negative 6.0 percent, down from positive 2.2 percent in February.
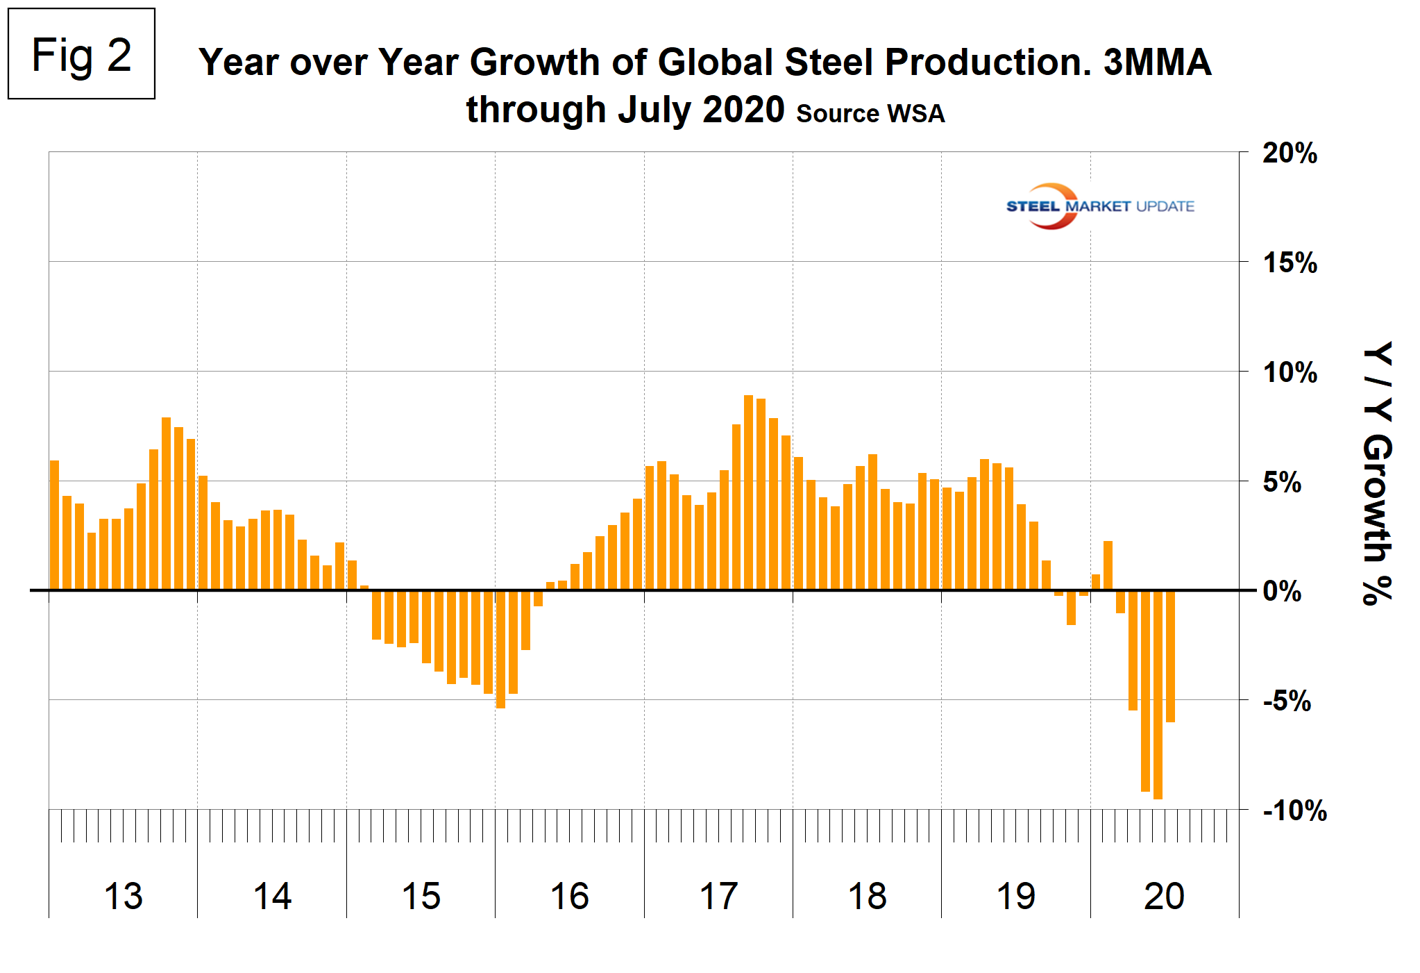
Table 1 shows global production broken down into regions, the production of the top 10 nations in the single month of July, and their share of the global total. It also shows the latest three months and 12 months of production through July with year-over-year growth rates for each period. Regions are shown in white font and individual nations in beige. Overall, the world had growth of negative 6.0 percent in three months and negative 2.8 percent in 12 months through July. When the three-month growth rate is lower than the 12-month growth rate, as it has been every month since June 2019, we interpret this to be a sign of negative momentum. On the same basis in July, China grew by 6.0 percent and 4.1 percent, and therefore also had positive momentum also for the first time since June last year. China was the only country to have positive growth in both three months and 12 months through July.
Table 1 shows that North America was down by 30.3 percent in the three months through July. Within North America, production was down by 32.0 percent in the U.S. down by 24.1 percent in Canada and down by 25.5 percent in Mexico. (Canada and Mexico are not shown in Table 1 and the North American total includes Cuba, El Salvador and Guatemala.)
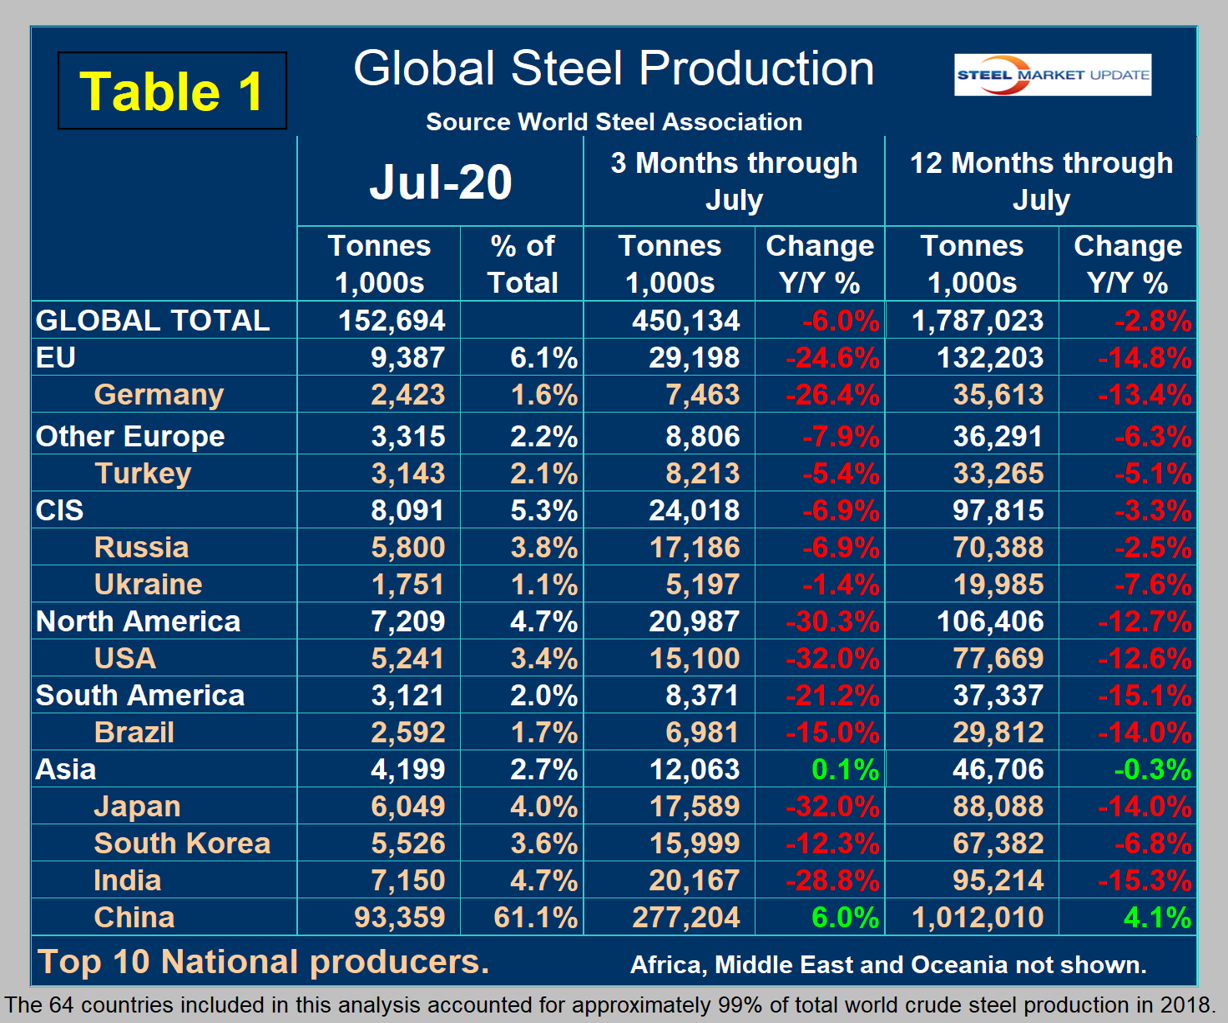
In the 12 months through July, 106.4 million metric tons of steel were produced in North America, including 77.7 million tons in the U.S., 11.7 million tons in Canada and 16.5 million tons in Mexico. Based on the latest OECD capacity data, U.S. capacity in 2019 was 109.7 million metric tons and capacity utilization in that year was 80.0 percent.
Figure 3 shows China’s production since 2005. In the single month of July, China’s steel production hit an all-time high of 93.4 million tons, which is an annual production rate of 1.12 billion tons. China’s capacity is now 1.152 billion metric tons, a reduction from 1.215 billion tons in January 2015. July capacity utilization was 89.7 percent, which as a result of the capacity reduction and production increases was up from 67.3 percent in January 2015.
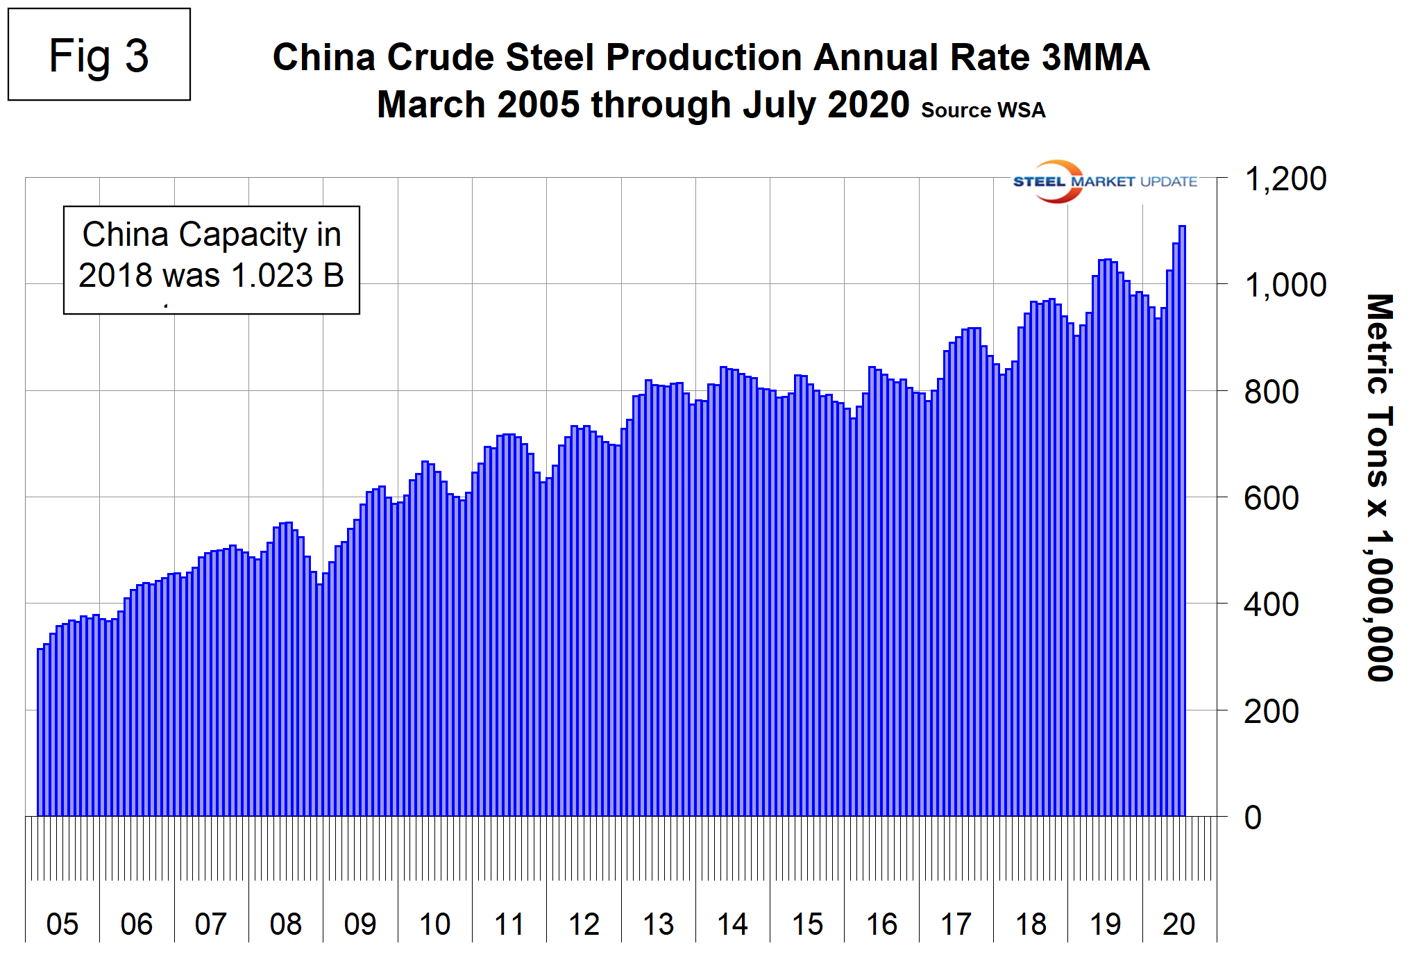
Figure 4 shows the growth of China’s steel production since March 2013 and Figure 5 shows the growth of global steel excluding China on the same scale both on a 3MMA basis. In July, the rest of the world contracted by 16.6 percent as China grew by 6.0 percent.
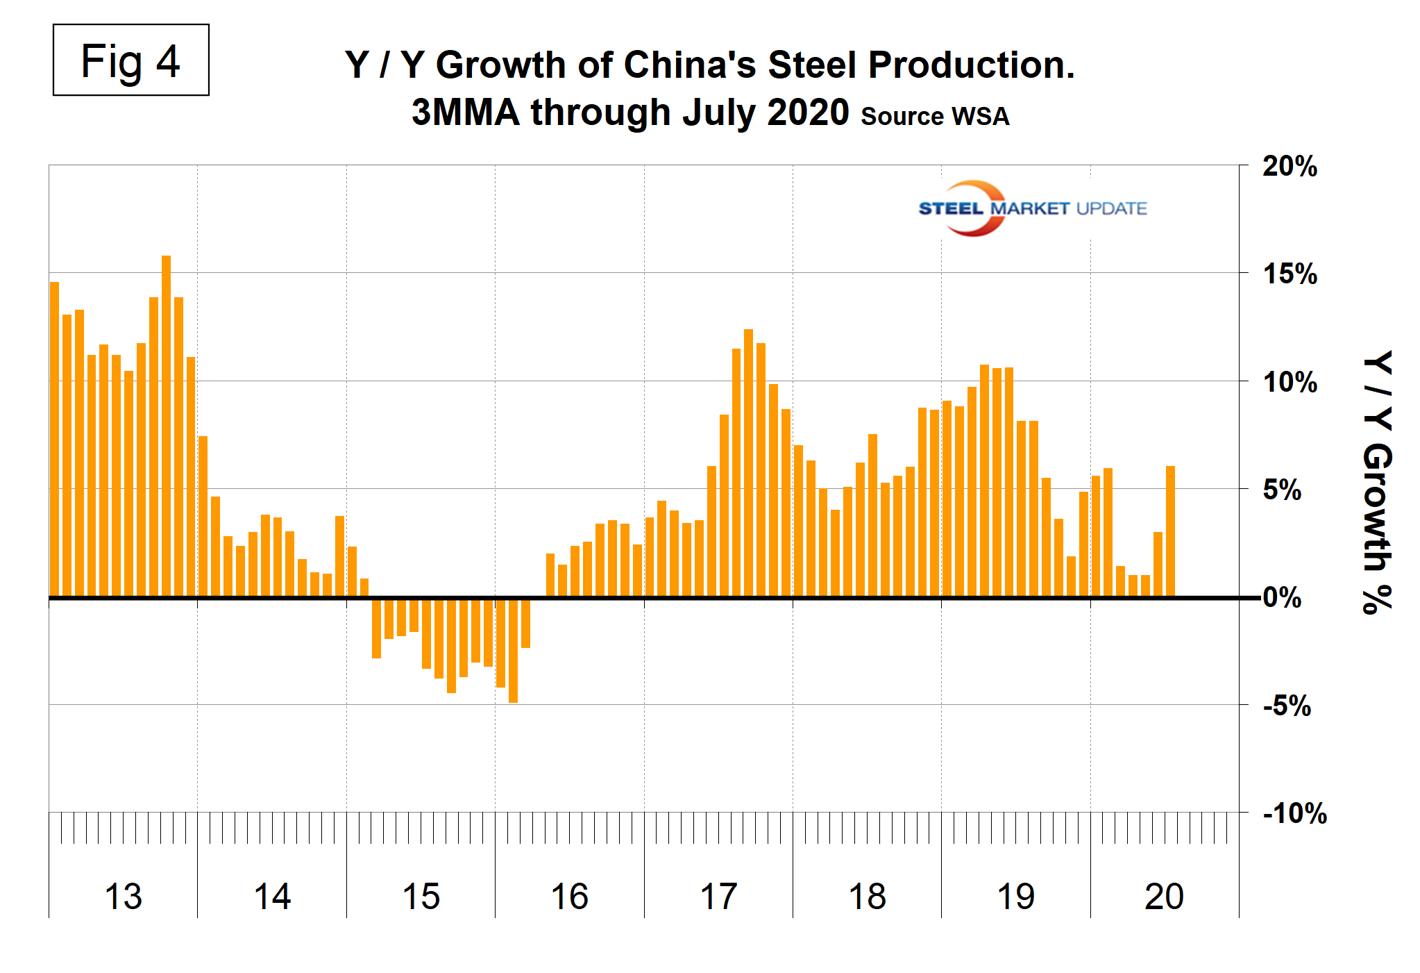
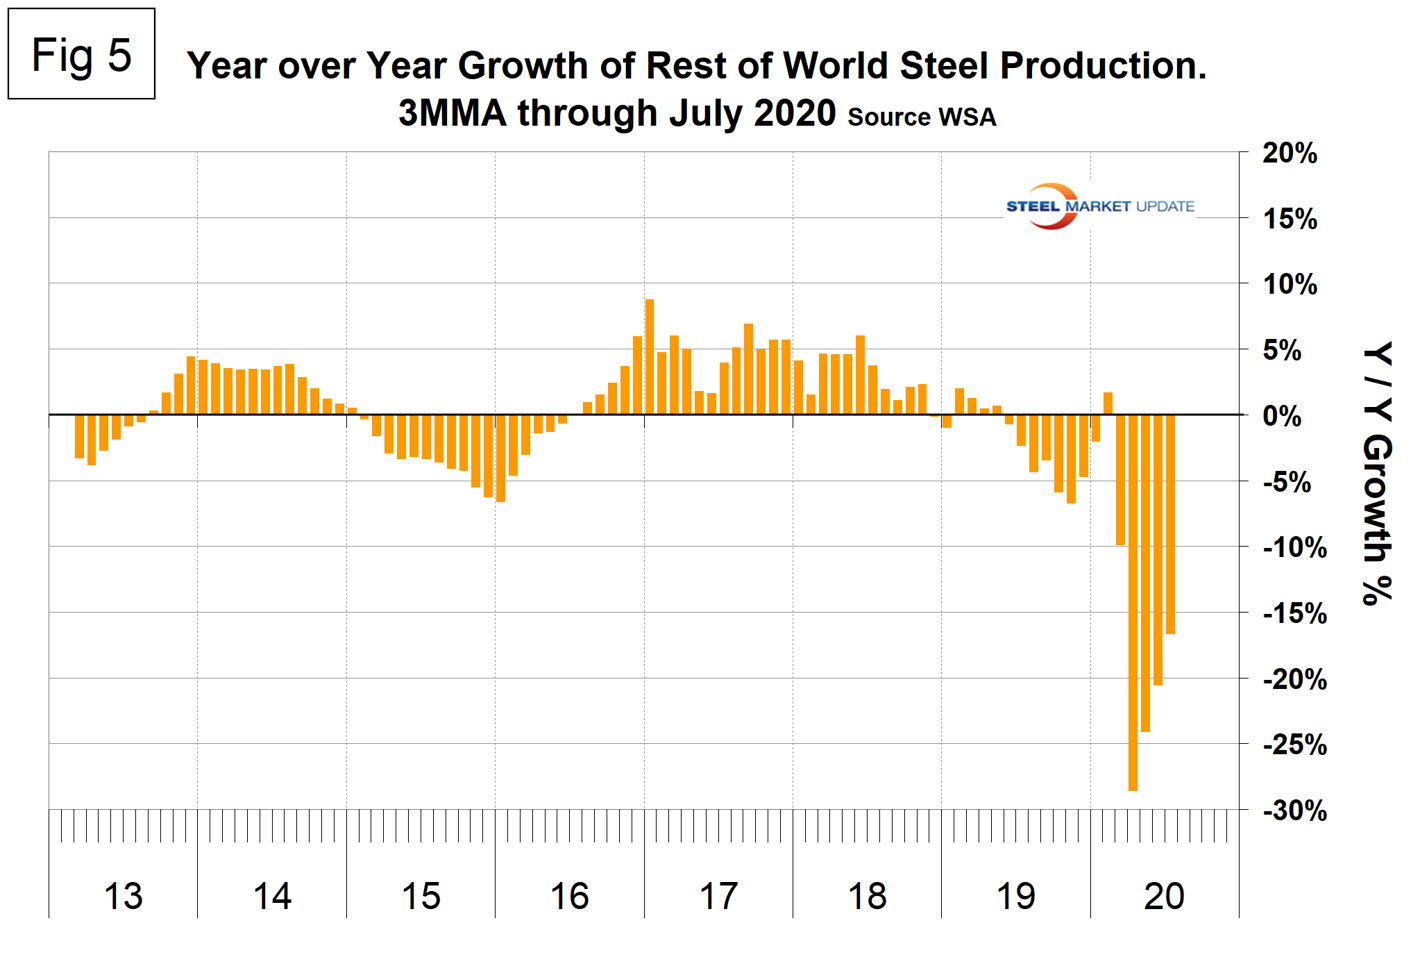
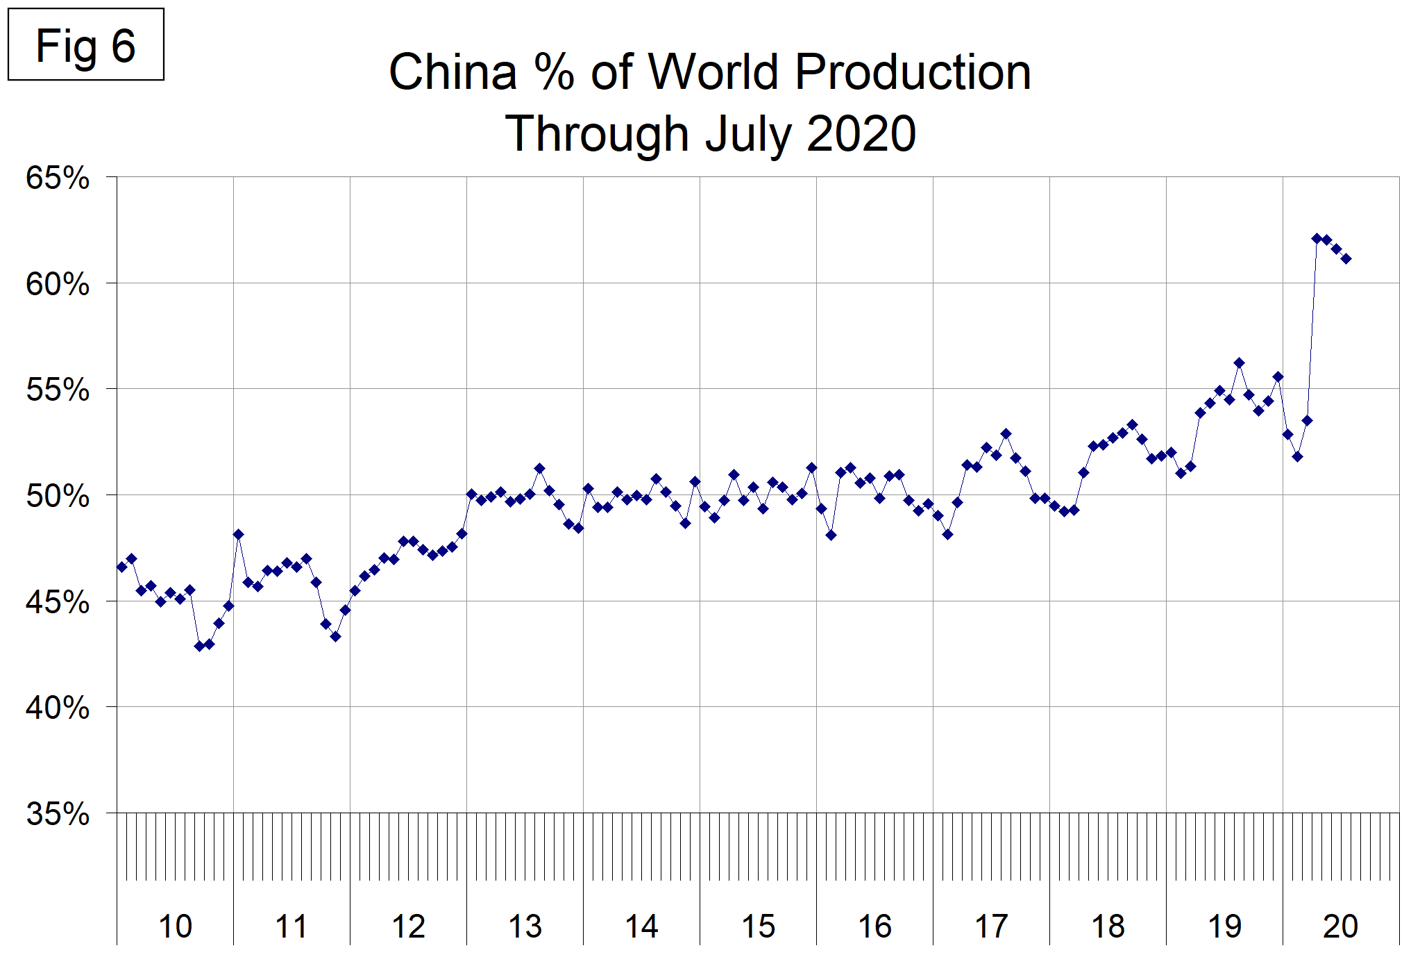
Figure 6 shows the growth of China’s share of global steel production, which averaged 61.7 percent in the four months April through July.
NOTES: On June 24, 2020, the OECD released its updated report of steel production capacity by nation. “Global steelmaking capacity (in nominal crude terms) decreased from 2015 to 2018, but the latest available information (as of December 2019) suggests that capacity increased in 2019 for the first time since 2014. The OECD has revised its 2019 figures for global steelmaking capacity to 2,362.5 million metric tonnes (mmt) to incorporate new information on closures that was not previously available as well as updated information on the status of certain investment projects. Moreover, revisions to the aggregate capacity figures for the People’s Republic of China, the United States, Mexico, Japan, Korea, and several other economies’ data contributed to the upward revision for 2019 and previous years. The net capacity change in 2019, taking into account new capacity additions and closures, represents a 1.5 percent increase from the level at the end of 2018.”
WSA released its short range forecast on June 4, 2020, which anticipates that global production will be down by 6.4 percent in 2020 and up by 3.8 percent in 2021. On the same basis, North America will be down by 20.0 percent and up by 6.2 percent.
WSA represents approximately 85 percent of the world’s steel production, including over 160 steel producers, national and regional steel industry associations, and steel research institutes. Note at the bottom of Table 1, WSA says this represents 99 percent of steel production, so presumably there are reports of production by countries that include non-members.) The OECD has taken over responsibility for tracking global steel capacity and its latest update was for 2019, released in June 2020.


