

Market Data

December 22, 2021
Steel Mill Lead Times: Within a Week of Normal
Written by Tim Triplett
In line with the declining steel prices, lead times for spot orders from the mills continue to shorten with the average for hot rolled now below five weeks and cold rolled and galvanized now below eight weeks, based on Steel Market Update’s check of the market on Monday and Tuesday. Lead times for all products are the shortest they have been in 2021 and are comparable to where they were in September/October 2020. Lead times are a sign of activity at the mill level and are considered a leading indicator of finished steel prices.
Buyers polled by SMU this week reported mill lead times ranging from 3-9 weeks for hot rolled, 5-10 weeks for cold rolled, 5-11 weeks for galvanized, 8-10 weeks for Galvalume, and 4-6 weeks for plate.
The average lead time for hot rolled has declined to 4.92 weeks from 5.04 weeks in mid-December. Cold rolled lead times now average 7.53 weeks, a decline from 8.35 two weeks ago. Galvanized lead times dipped to 7.50 weeks from 8.19 weeks in the same period. The average Galvalume lead time remains about the same at 8.83 weeks.
Like sheet products, mill lead times for plate also continue to shorten. The average plate lead time moved down to 5.40 weeks from the 6.38 weeks seen in SMU’s market check two weeks ago.
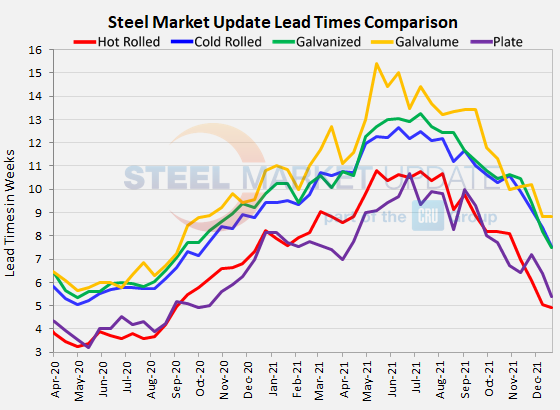
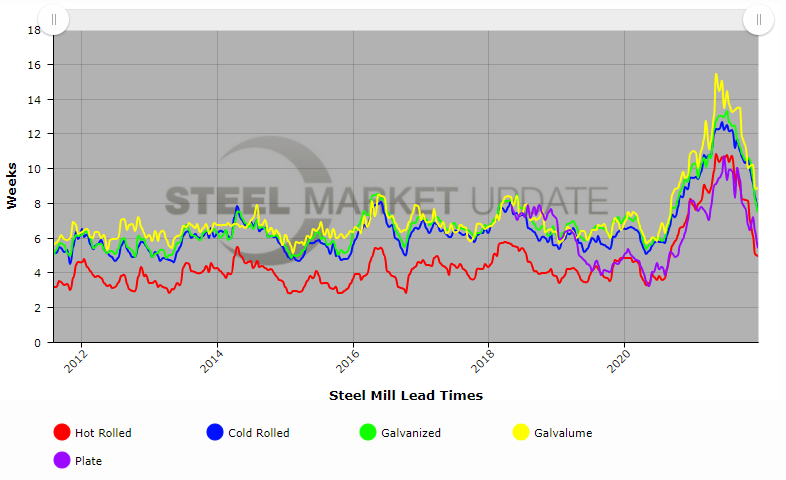
To put those numbers in perspective, hot rolled lead times have averaged 4.59 weeks, cold rolled lead times 6.59 weeks and galvanized lead times 6.92 weeks in data gathered by SMU over the past decade. Therefore, lead times are now within a week of being what might be considered “normal” after a long period of historic highs.
By Tim Triplett, Tim@SteelMarketUpdate.com


