

SMU Key Market Indicators
Key Market Indicators
Steel Market Update’s Key Market Indicators are composed of economic and steel industry factors that are compiled and analyzed by SMU market analysts. They are broken into the following categories: General Economy, SMU Indices, Long Product Steel, Flat Rolled Steel, Construction, and Manufacturing. The table below represents the current meta-analysis of all of our Key Steel Market Indicators. For more information about each data set please click on the links in the ‘Indicators’ box to the right. An explanation of the Key Market Indicators is provided in the table below.
All of the data and analysis contained in the Key Market Indicators is available to Premium subscribers only.
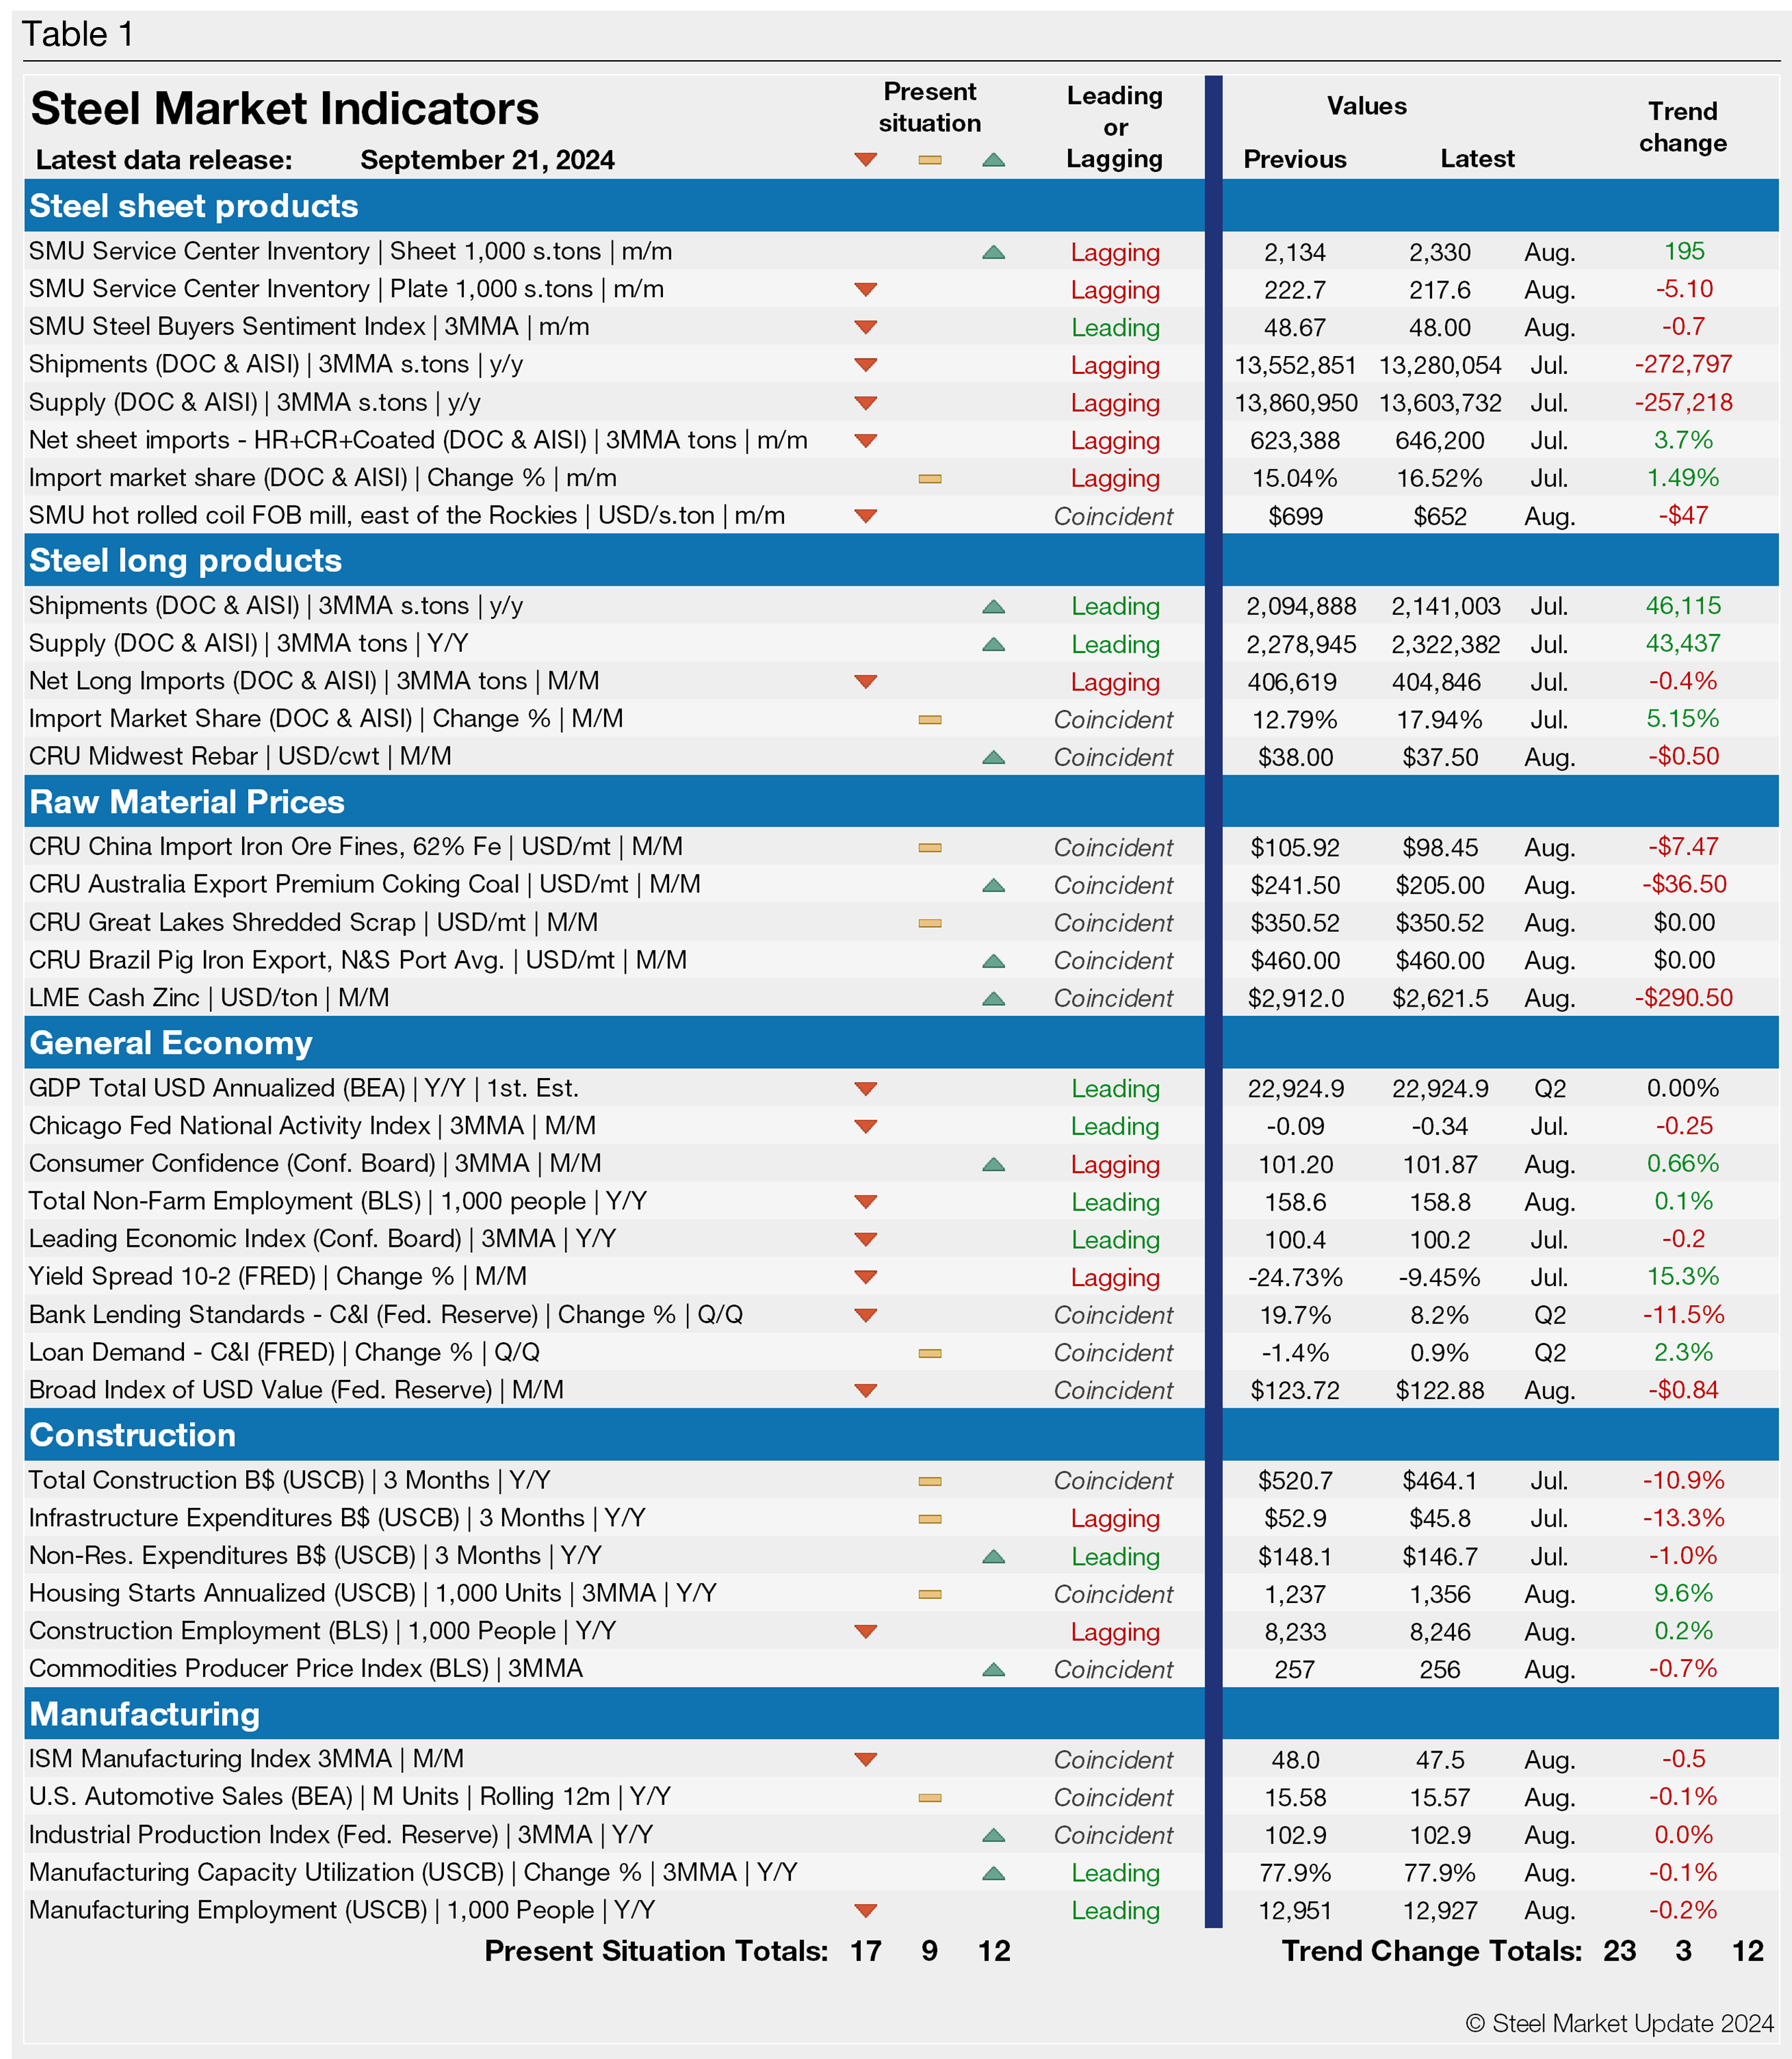
Explanation: The key indicators chart is designed to give a snapshot of the steel market on a specific date. The chart is stacked vertically to separate the primary indicators of the general economy, of proprietary Steel Market Update indices, of both flat rolled and long product market indicators and finally of construction and manufacturing indicators. The indicators are classified as leading, coincident or lagging as indicated.
Columns in the chart are designed to differentiate between the current situation and the direction in which the market is headed. The present situation is sub-divided into, below the historical norm (-), (OK), and above the historical norm (+). The “Values” section of the chart is a quantitative definition of the market’s direction. In cases where seasonality is an issue, the evaluation of market direction is made on a three month moving average basis and compared year over year to eliminate this effect. Where seasonality is not an issue concurrent periods are compared. The date of the latest data is identified in the third values column. Values will always be current as of the date of publication. Finally, the far right column quantifies the trend as a percentage or numerical change with color code classification to indicate positive or negative direction.
History of Key Market Indicators:
2023
2022
2021
- December 15, 2021
- November 19, 2021
- October 19, 2021
- September 22, 2021
- August 18, 2021
- July 16, 2021
- June 18, 2021
- May 17, 2021
- April 15, 2021
- March 15, 2021
2020
2019
- December 31, 2019
- November 30, 2019
- October 29, 2019
- September 30, 2019
- August 31, 2019
- July 31, 2019
- May 31, 2019
- April 30, 2019
- March 31, 2019
- February 28, 2019
- January 31, 2019