

Market Data

March 8, 2017
US Gross Domestic Product by Region and by State - Q3 2016
Written by Peter Wright
The Bureau of Economic Analysis (BEA) introduced a new data set for GDP by state and region in 2014 and backdated it to Q1 2005. This week the data was updated through Q3 2016. Even though we might consider this to be historically “old,” we think it’s worth reporting because it is a foundation for where we are now. The data is published quarterly and is reported in chained 2009 dollars seasonally adjusted. We at SMU analyze the data and report to our subscribers quarterly by region. Should anyone wish to see data and graphs for an individual state, we will supply on a one off basis. Table 1 show the growth of regional GDP in chained 2009 dollars quarter on quarter (these numbers are not annualized as is the case for published reports of the growth of national GDP.)
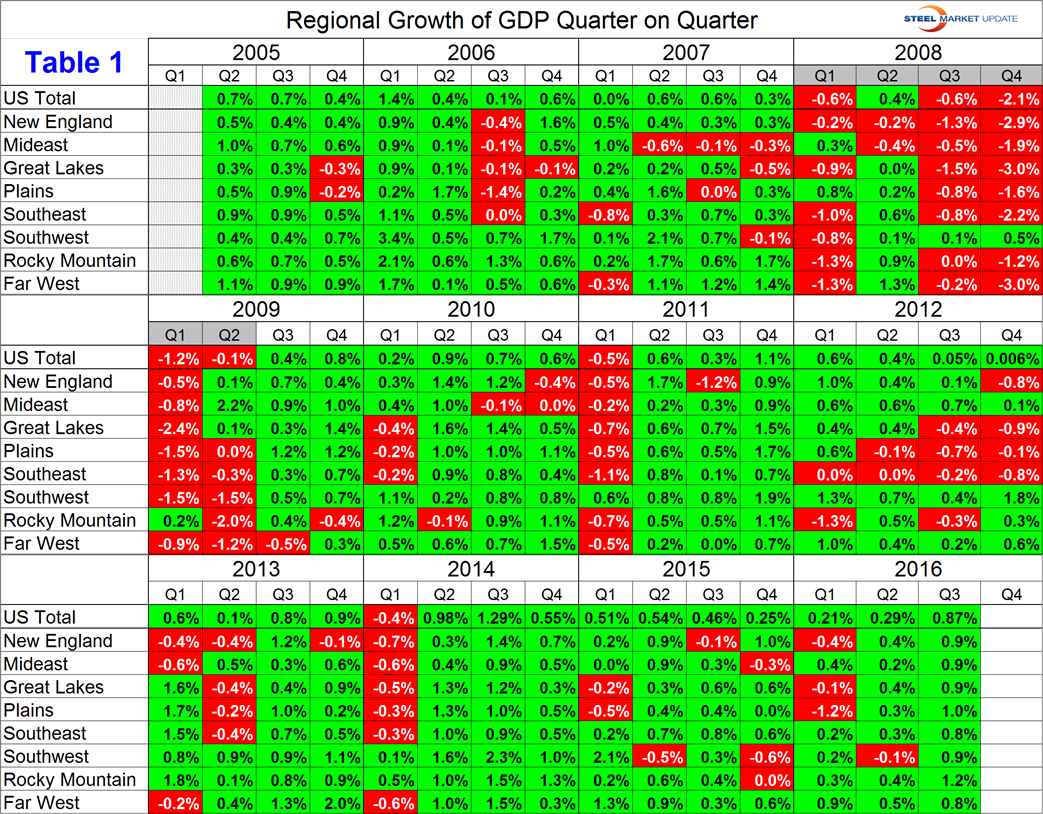
Our first impression of this data is that it is spottier than we expected however all regions had positive growth in Q3 2016. Some points to note are that naturally the great recession is very obvious: the definition of a recession is two or more quarters back to back with negative growth. Three regions were in recession in the second half of 2012.
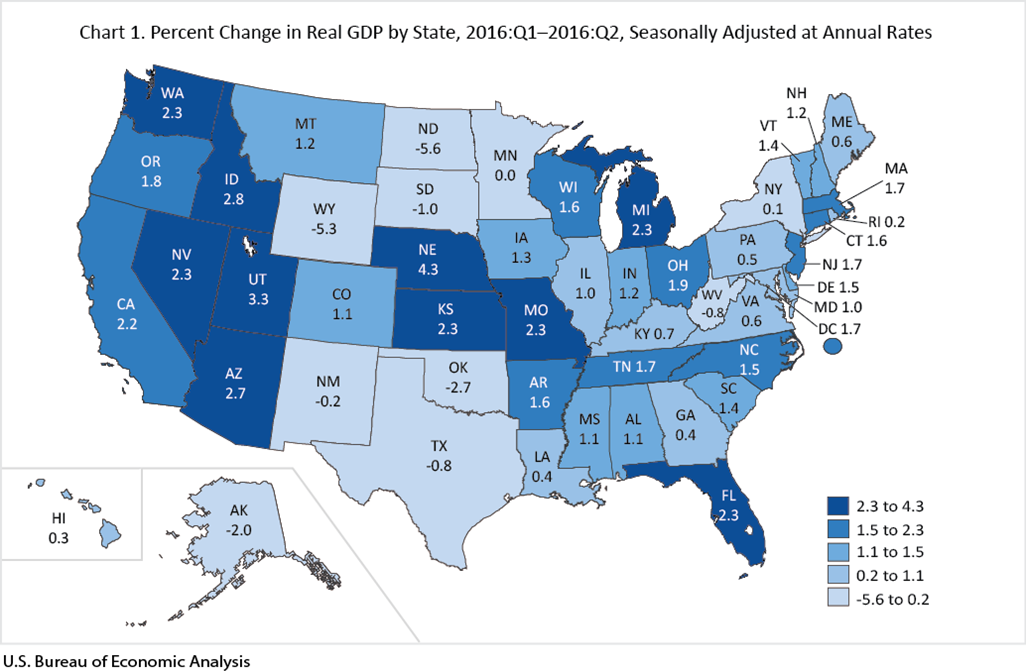
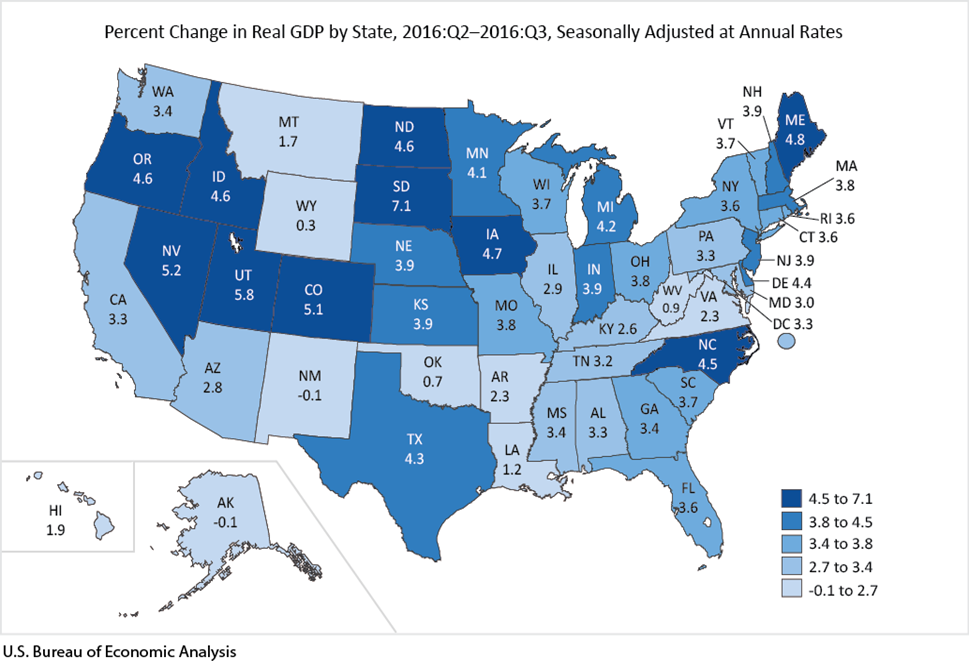
The BEA produces a map of the United States showing Q/Q growth by state within each region. We have included here the maps for both Q2 and Q3 to enable readers to see how their individual states progressed between the two quarters. Alaska and New Mexico both had a very small negative growth in Q3. All other states were positive.
Regions as defined by the BEA are as follows:
New England: Connecticut, Maine, Massachusetts, New Hampshire, Rhode Island, Vermont.
Mideast: Delaware, DC, Maryland, New jersey, New York, Pennsylvania.
Great Lakes: Illinois, Indiana, Michigan, Ohio, Wisconsin.
Plains: Iowa, Kansas, Minnesota, Missouri, Nebraska, North Dakota, South Dakota.
South East: Alabama, Arkansas, Florida, Georgia, Kentucky, Louisiana, Mississippi, North Carolina, South Carolina, Tennessee, Virginia, West Virginia.
South West: Arizona, New Mexico, Oklahoma, Texas
Rocky Mountain: Colorado, Idaho, Montana, Utah, Wyoming.
Far West: Alaska, California, Hawaii, Nevada, Oregon, Washington.
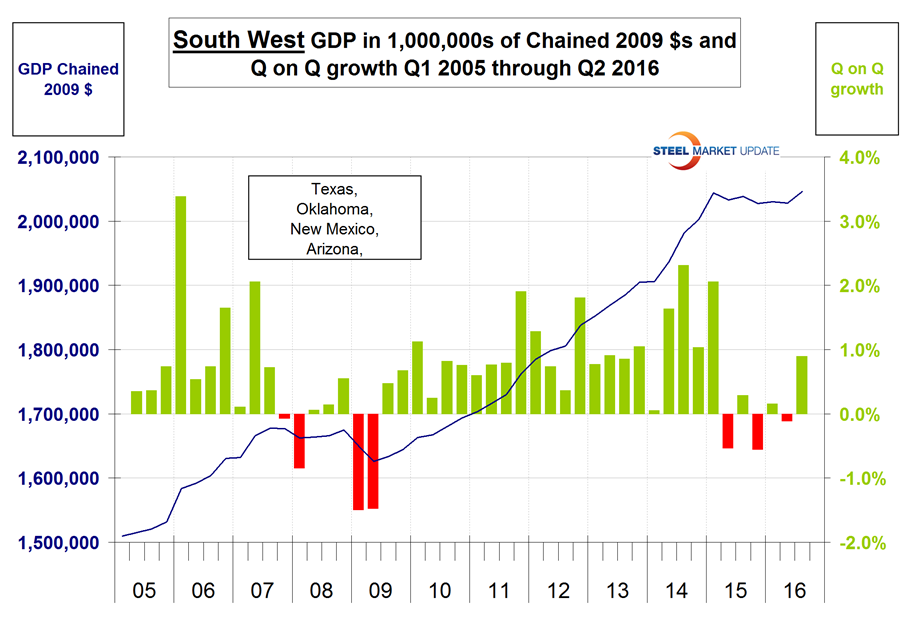
In the third quarter of 2016, the Rocky Mountain region had the highest growth rate at 1.2 percent followed by the Plains at 1.0 percent. The South West region flipped from the highest growth rate in Q1 2015 to negative growth in Q2 2015 and had no net growth for five back to back quarters before bouncing back in Q3 2016 as shown in Figure 2.
Once a quarter we at SMU publish a report of regional job creation which we hope along with this analysis of regional GDP will enable subscribers to compare their own corporate results with those of their region to establish whether their business is swimming up or down stream.
Figure 2 is intended to show readers an example of the graphs that we can produce on request for individual regions and states.
The U.S. values in this report are quite a bit different and lower that the official report published in the National Income and Product Account (NIPA) reports partly because the GDP-by-state numbers exclude Federal military and civilian activity located overseas (because it cannot be attributed to a particular state). The official quarterly report of national GDP is also annualized which as we always report in our quarterly analysis increases the value by a factor of four.


