Analysis

March 21, 2017
US Vehicle Sales and NAFTA Vehicle Production through February 2017
Written by Peter Wright
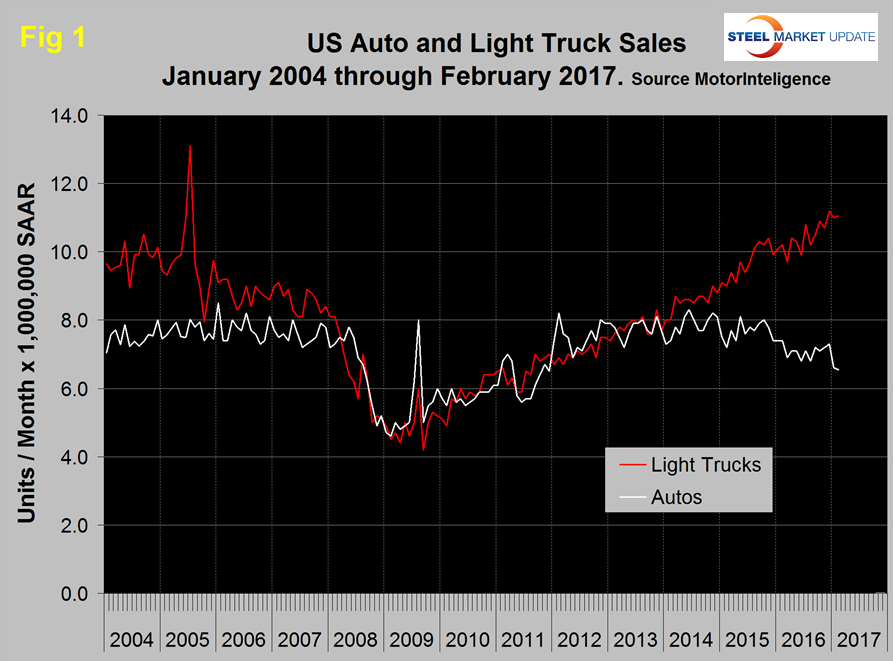
The unseasonably warm weather in February resulted in vehicle sales being stronger than expected. On a seasonally adjusted annual basis, sales were 17.58 million units. Truck sales continued to capture market share as gas prices remained steady and incentive spending remained high. Moody’s expect auto sales to settle in at about 16.5 million units later this year or early next year. Figure 1 shows auto and light truck sales since January 2004.
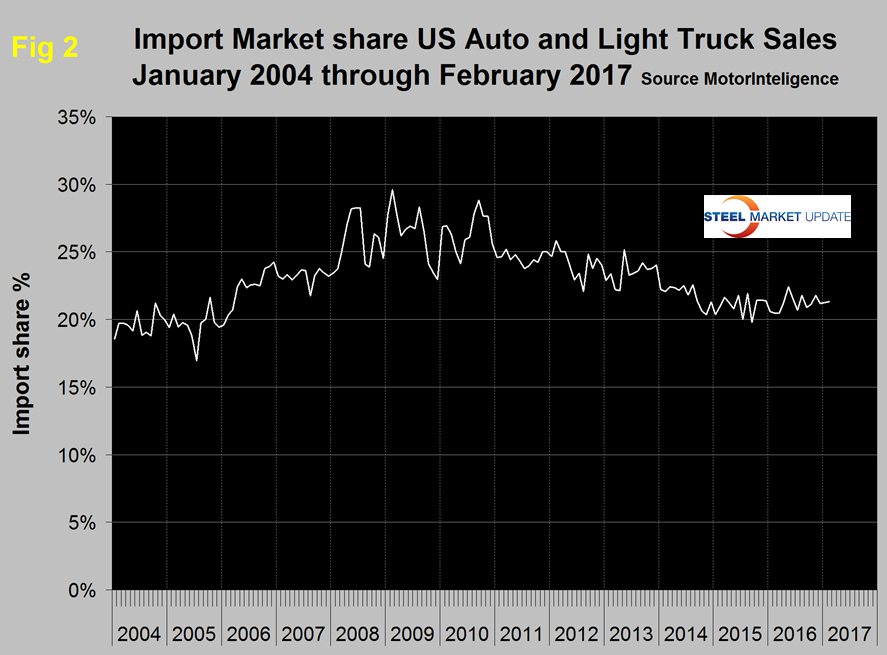
Import market share at 21.3 percent in February has changed little in the last year as shown in Figure 2.
Total light vehicle (LV) production in NAFTA in February was at an annual rate, of 17.5 million units, up from 16.6 million in January and from 15.2 million in December. On average since 2004, February’s production has been 8.0 percent higher than January. This year production was up by 5.1 percent therefore slightly weaker than normal (Figure 3).
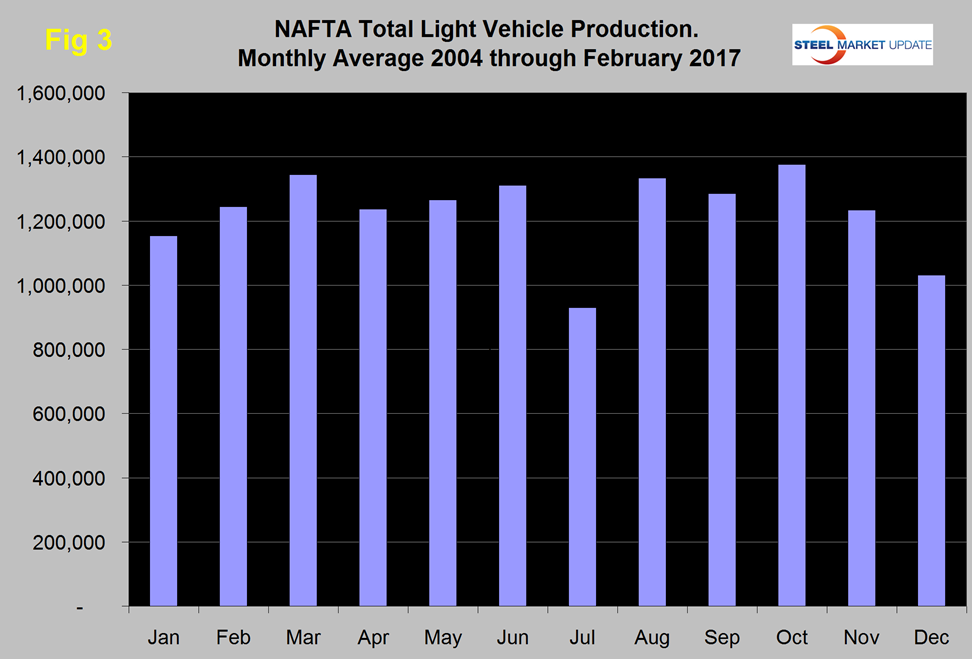
We can expect production to increase again in March. Note: production numbers are not seasonally adjusted: the sales data reported above are seasonally adjusted.
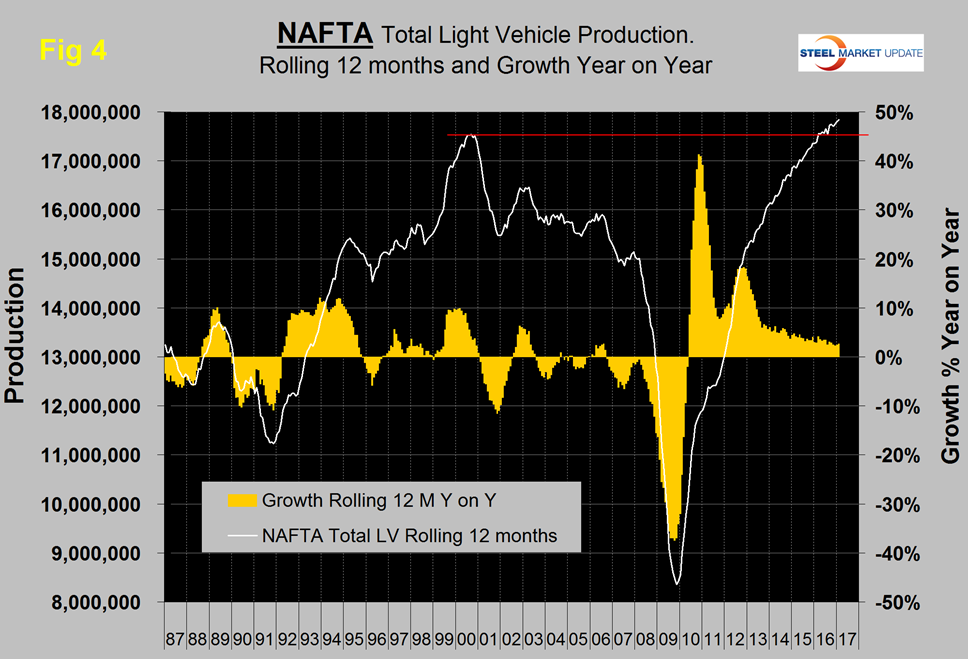
On a rolling 12 months basis y/y through February, LV production in NAFTA increased by 2.6 percent which was up from 2.5 percent in 12 months through January and 2.3 percent in 12 months through December. There has been a very gradual slowdown in growth for the last three years as indicated by the brown bars in Figure 4; however production has been higher than the previous all-time high every month since early 2016.
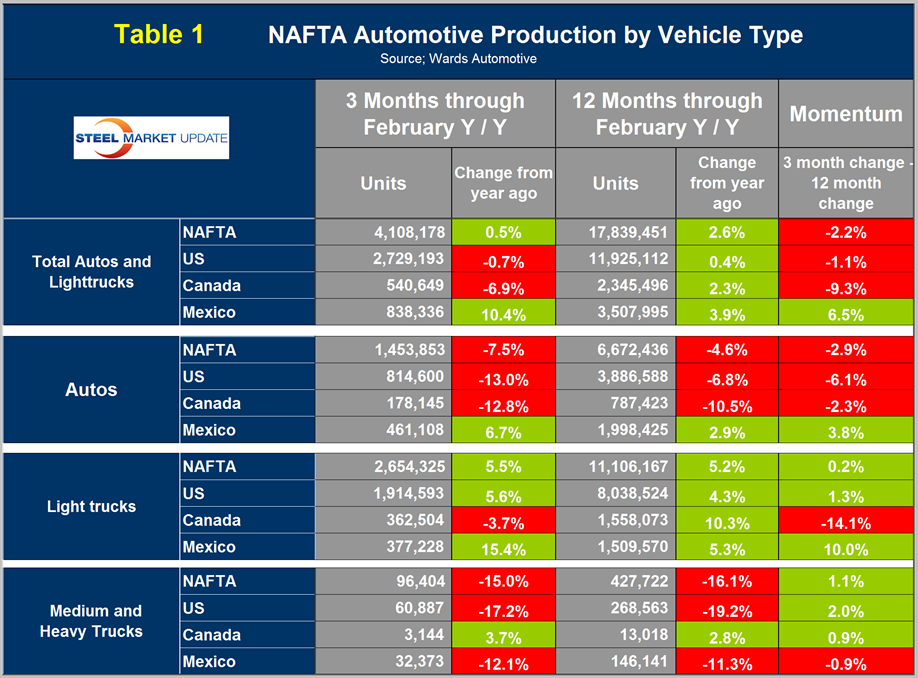
On a rolling 12 months basis y/y the US was up by 0.4 percent with negative momentum, Canada was up by 2.3 percent with very negative momentum and Mexico was up by 3.9 percent with very positive momentum (Table 1).
The eight months July through February were the first months for Mexico to have positive momentum after fourteen straight months of slowdown. Canada experienced negative momentum in July through February following very strong momentum in the previous six months. On a rolling 3 months basis y/y since early 2016, Mexico has gained production share mainly at the expense of Canada (Figure 5) and the Mexican and US shares have been almost mirror images of each other as production has shifted backwards and forwards across the border with not much net change.
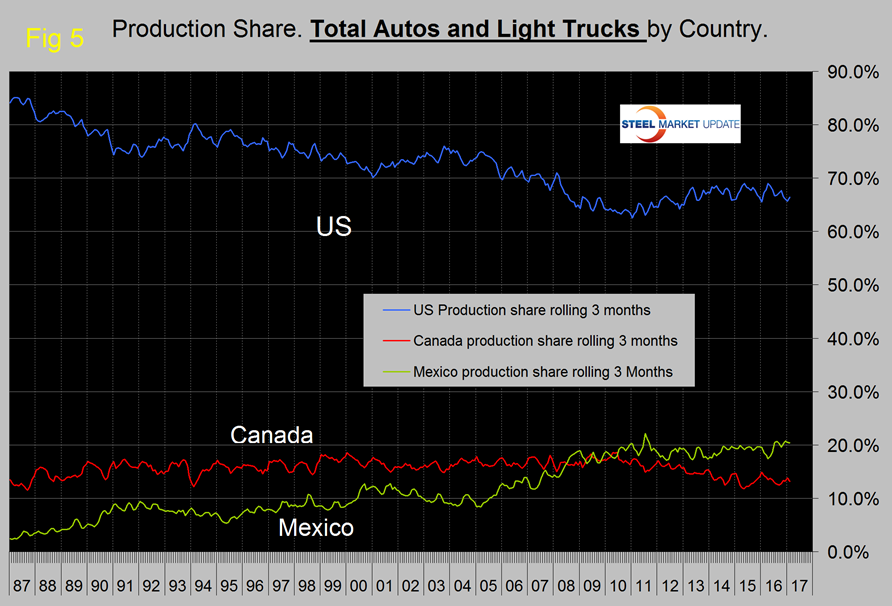
In February on a rolling three month basis, the US production share of total light vehicles was 66.4 percent which was lower than the 67.2 percent average for 2016. Canada’s was 13.2 percent which was worse than the 13.4 percent average for 2016. Mexico’s was 20.4 percent and was better than the 19.3 percent average for 2016. Production in Mexico was 3.194 million units, 3.386 million units and 3.458 million units in 2014, 2015 and 2016, respectively. The Mexican production target for 2020 is 5.0 million units according to Eduardo Solis, president of the Mexican Automotive Industry Association.
Figures 6, 7 and 8 show total LV production by country with y/y growth rates and on each the red line shows the change in production since Q2 2006.
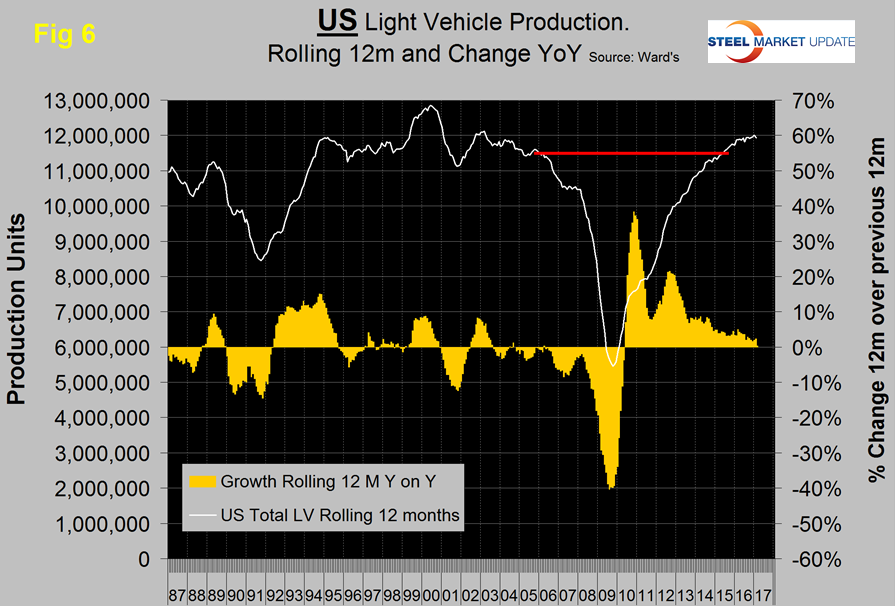
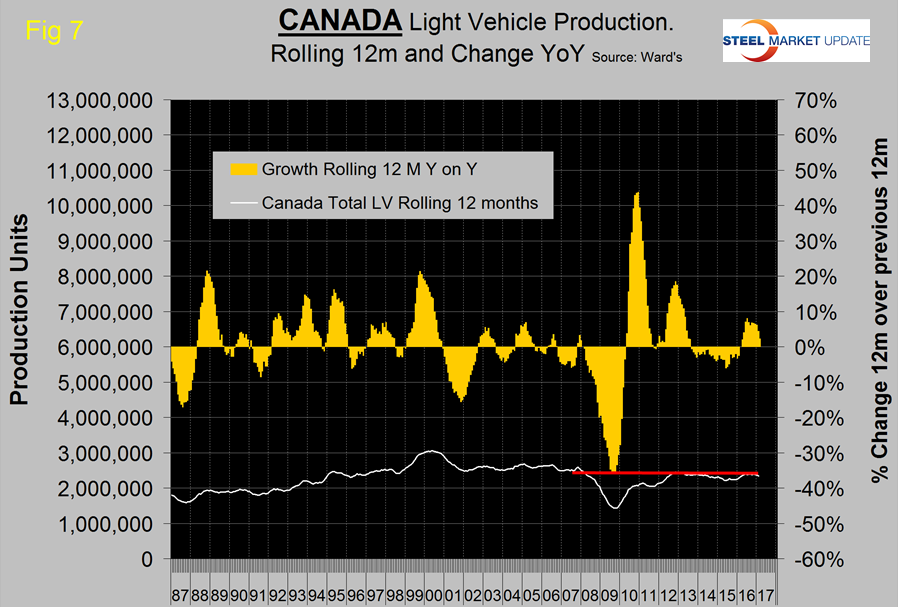
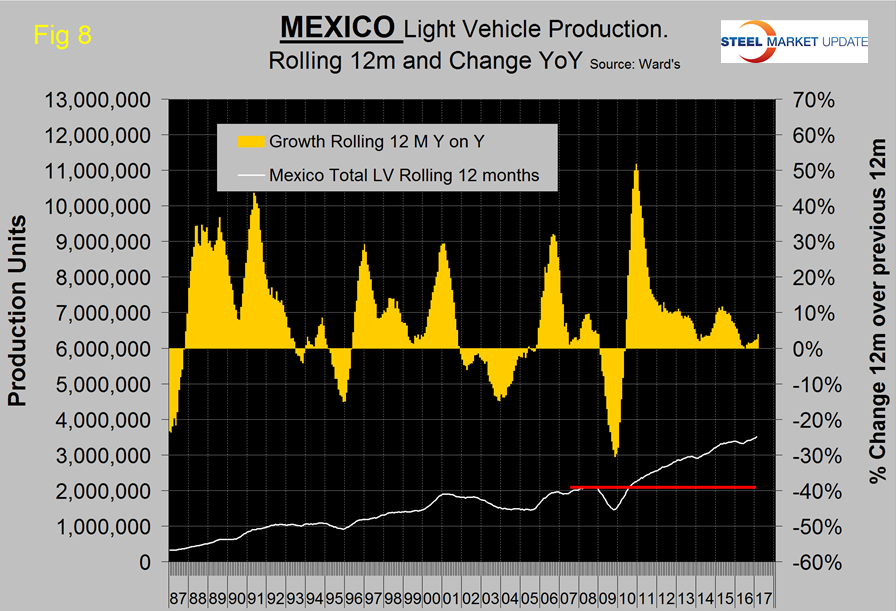
Note the scales are the same to give true comparability and that Mexican growth slowed significantly from mid-2015 through mid-2016 and has recovered slowly since then. During the recession, Mexico declined by less than the US and bounced back by more during the recovery. This caused Mexico’s production share to surge until Mid-2011 at the expense of the US.
Figure 9 shows that the percentage of autos in the light vehicle production mix has been declining for all three countries since 2012, driven by consumer buying preferences which in turn are heavily influenced by gas prices.
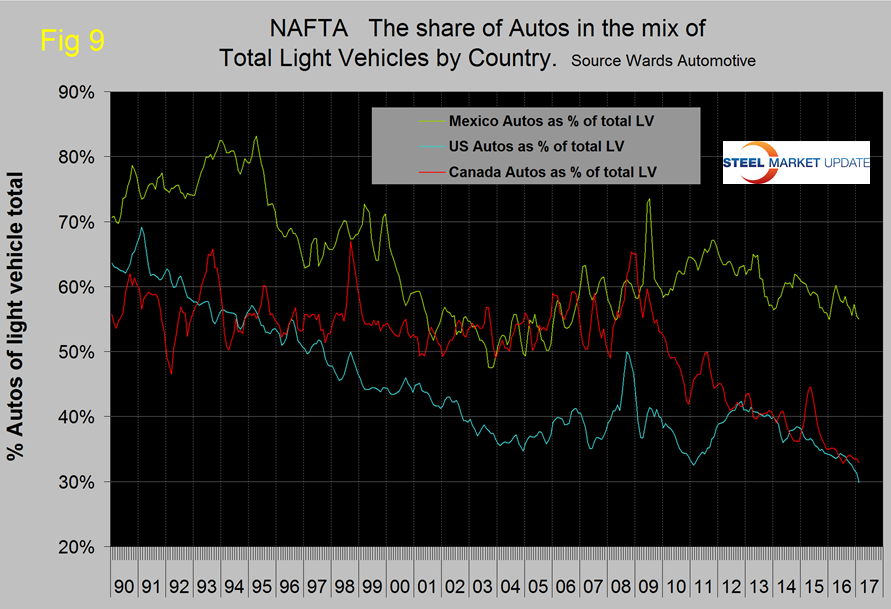
SUVs are classified as light trucks which must be the main driver of the shift in mix. The change in preference for light trucks tends to favor the US and Canada over Mexico because the mix of light vehicle production capacity is different by country. The percentage of autos in the Mexican mix in the last three months was 55.0 percent but only 29.8 percent in the US and 33.0 percent in Canada. This was the first time for the auto percentage in the US mix to fall below thirty since our data stream began in January 1990. Mexico has staked out a higher relative capacity in autos which will serve it well when gas prices eventually rebound.
Ward’s Automotive reported this week that total light vehicle inventories in the US were 74 days at the end of February, which was down from 85 days at the end of January but up from 62 days at the end of December. Month over month FCA (Fiat Chrysler Automotive) was down by 9 days to 83, GM was down by 17 days to 91, and Ford was down by 17 to 78 days.
The SMU data file contains more detail than be shown here in this condensed report. Readers can obtain copies of additional time based performance results on request if they wish to dig deeper. Available are graphs of auto, light truck and medium and heavy truck production and growth rate and production share by country.