

Market Data

March 28, 2017
Global Scrap Trade through Q4 2016
Written by Peter Wright
This is only our second ever write up of global scrap trade. In future we will report quarterly because we believe that to understand the gyrations of the domestic scrap market we should be aware of where the US stands as a global player. This data is not very current because some nations are slow to report but we still believe it gives a valuable perspective of global trends and is the foundation of where we are today.
In this analysis we have excluded scrap that was traded within the EU from the global total. Figure 1 shows the total tonnage of global trade since Q1 2000 and the volume of the top five suppliers. These five are the US, Japan, the EU, the UK and Russia and they accounted for 67.5 percent of the total in Q4 2016.
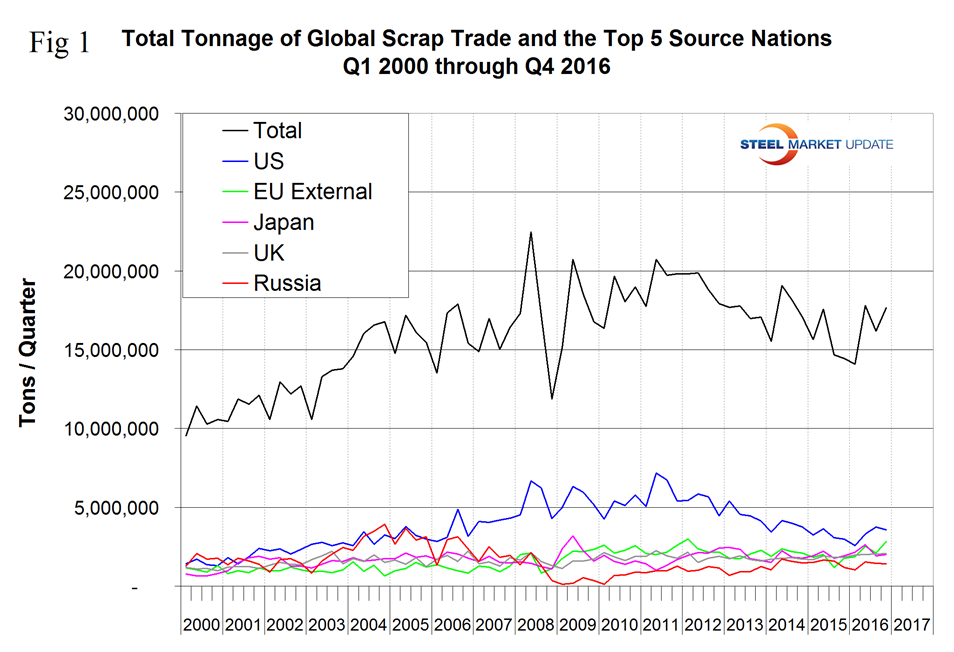
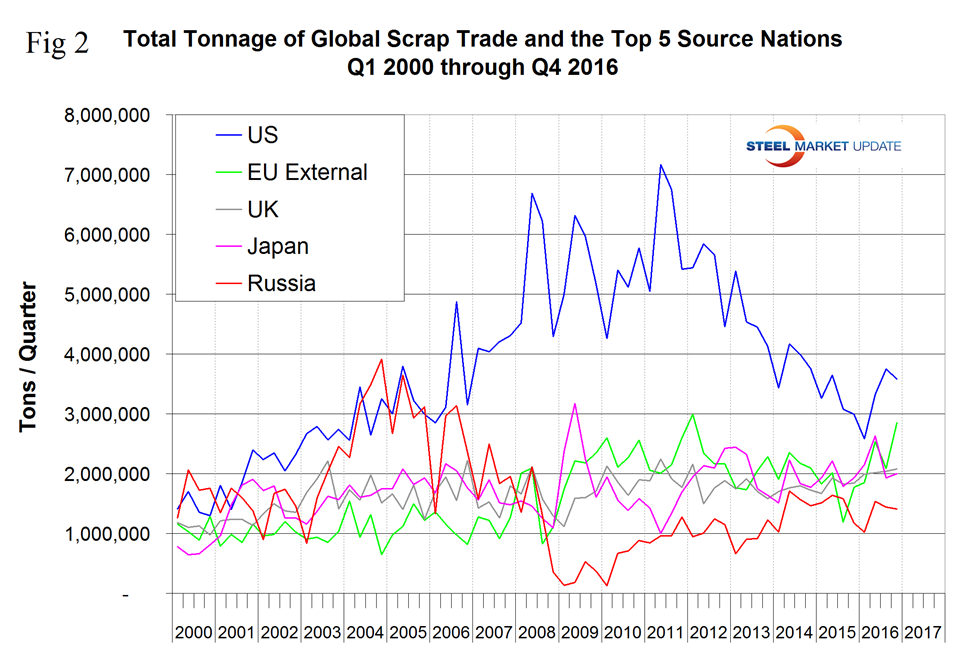
The total tonnage of ferrous scrap traded between nations in Q1 2016 was the lowest since the recession but bounced back in the remainder of the year. Figure 2 is the same graph with the total removed to better illustrate the volume of the five major players.
The US is still the biggest player on a tonnage basis and even more so on a global share basis. Figure 3 shows the market share of the top five sources.
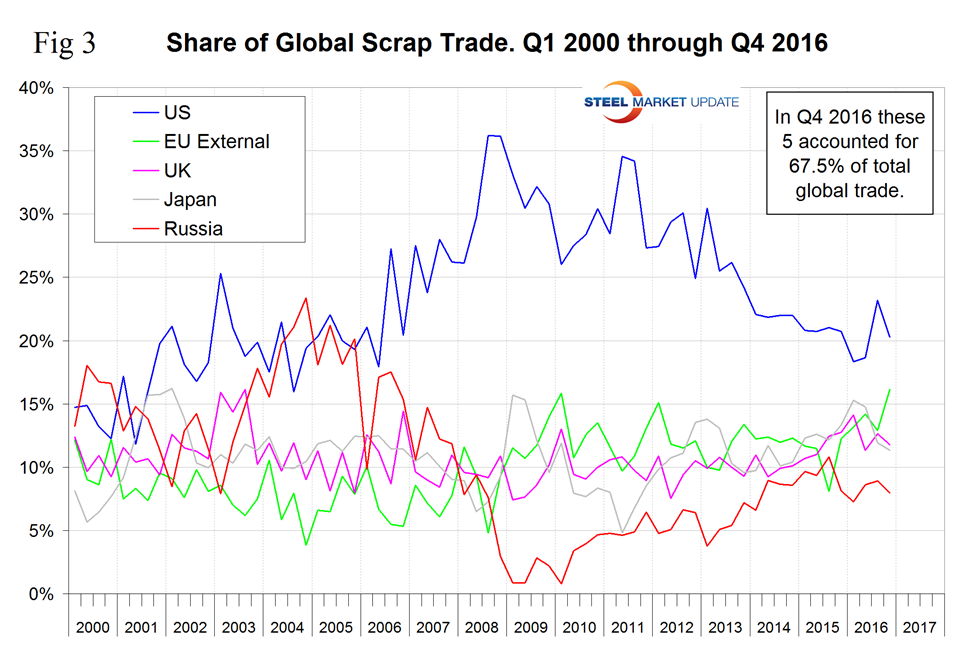
The US share peaked at 36.2 percent in the third and fourth quarters of 2008, fell steadily to 18.3 percent in the 1st quarter of 2016 and recovered to 20.3 percent in the fourth quarter. We attribute the long term US situation to both a decline in actual global commerce and the strengthening of the US $. The other four major players have maintained or increased their share, in other words the entire global decline in trade between second quarter of 2011 and the first quarter of 2016 was at the expense of the US. In the balance of 2016 that changed and the US share increased. This month we decided to investigate the relationship between the US global share and the US domestic scrap price. The result is shown in Figure 4 with a correlation of 66.8 percent which we believe confirms a significant (if obvious) influence.
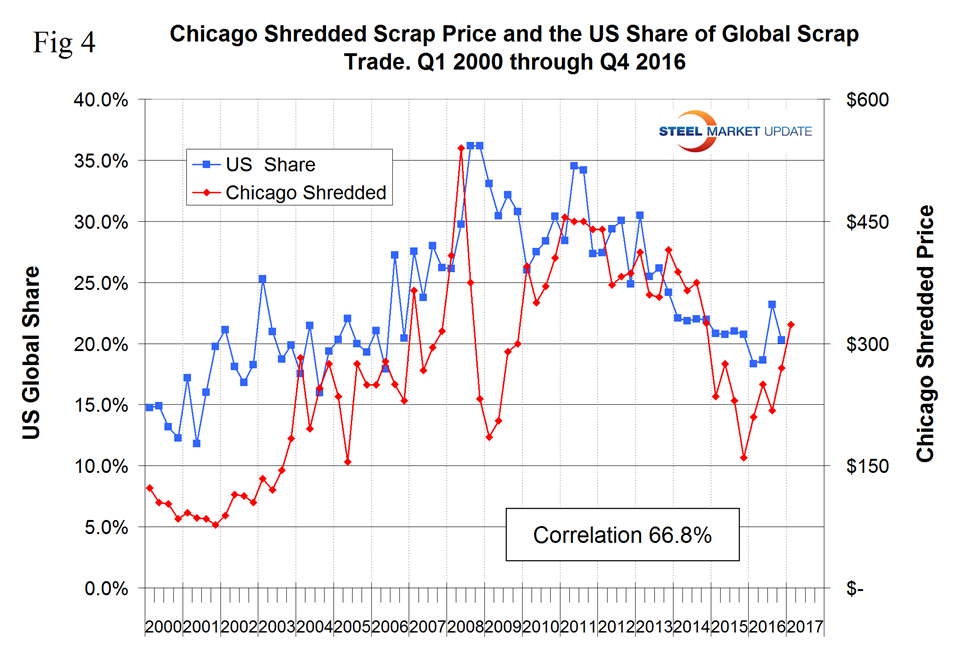
The big anomaly is 2009, the depths of the recession when the scrap price cratered but US share didn’t. In our next report we will check the correlation between the US trade tonnage and the scrap price. This will probably be better.
Figure 5 shows the tonnage received by the four major importing nations.
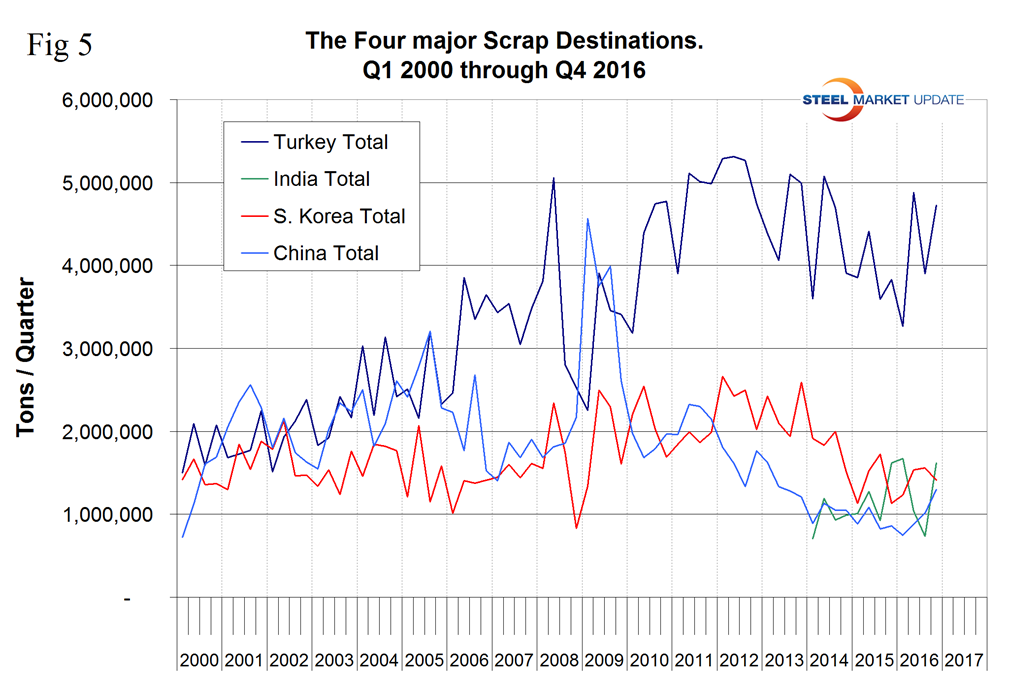
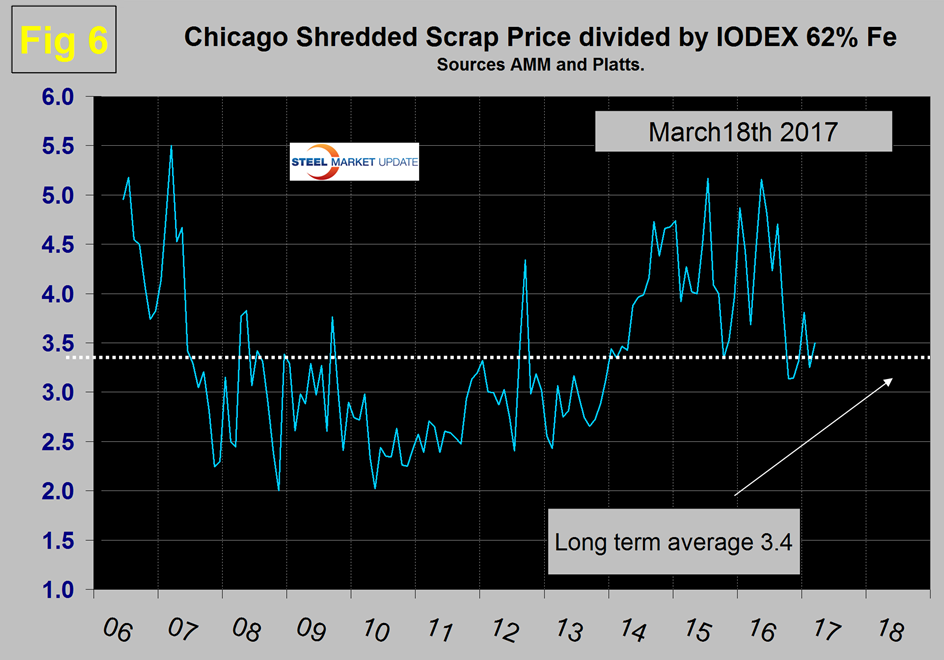
Our data for India only extends back through 2014. Turkey is by far the largest global scrap buyer with a tonnage more than the other three combined. Turkey has seen its share of total global purchases remain fairly constant at around 25 percent for the last 4 ½ years. We include China in this chart even though they are not much of a player on either side of the scrap trade equation. We expect that to change as the massive consumption of steel within China begins to be recycled. China’s steel production is 93 percent BOF therefore there will be a time when huge tonnages of scrap hit the global market. In the long run China will reduce its dependence on iron ore in preference for scrap but considering their already huge surplus in capacity, new investments in EAFs can be expected to be slow. Turkey’s import tonnage declined in 2014 and 2015 but recovered in 2016. Part of the reason for that decline was the purchase of semi-finished billets and slabs from China in particular. Chinese semi-finished was lower cost than the Turkish EAF mills could produce for themselves because iron ore was advantageously prices vs scrap and as mentioned earlier the Chinese producers are 93 percent BOF. This situation corrected in the Q4 2016 and the price ratio of scrap to ore is close to its long term average of 3.4 as shown in Figure 6.
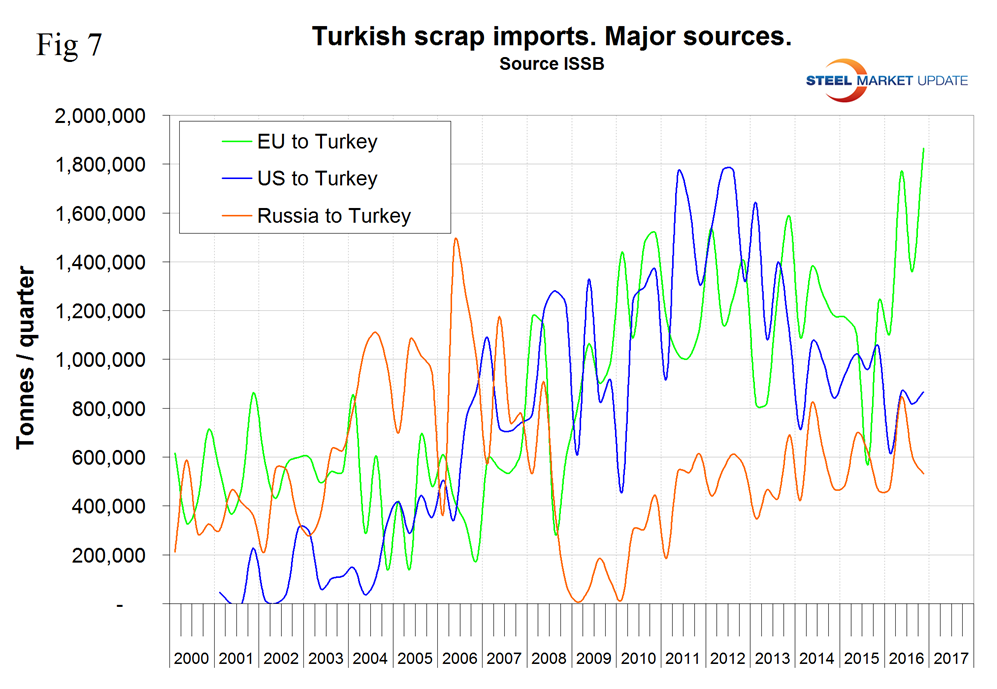
This was another contributor to the strengthening of domestic scrap prices in the US. In the period 2010 through 2013 Turkey purchased a similar tonnage from the US as it did from the EU but as the Euro has declined in US dollar terms their scrap has become more attractive and in Q2 2016 European shipments to Turkey surged to over double the US tonnage, Figure 7.
SMU Comment: We see three out of five trends in this analysis putting upward pressure on US domestic scrap prices in 2017. On the other hand a strengthening dollar will tend make US scrap exports less competitive and we see a huge disruption of the global scrap market on the horizon.
1. Global scrap trade declined through the first quarter of 2016 but increased strongly in the balance of the year.
2. US global share declined for over 4 years but recovered somewhat in the third and fourth quarters of 2016.
3. China is not yet a player in global scrap trade but we have to believe that a dramatic change is near at hand as the massive consumption of steel in China increasingly transforms to obsolete scrap.
4. In the two years from mid-2014 through mid-2016, the price ratio of iron ore to scrap made semi-finished out of China attractive compared to scrap. This is no longer the case.
5. The US $ will continue to strengthen as the Fed raises its target rate in 2017. This will dampen US scrap exports to some extent.


