Analysis

April 23, 2017
US Vehicle Sales and NAFTA Vehicle Production through March 2017
Written by Peter Wright
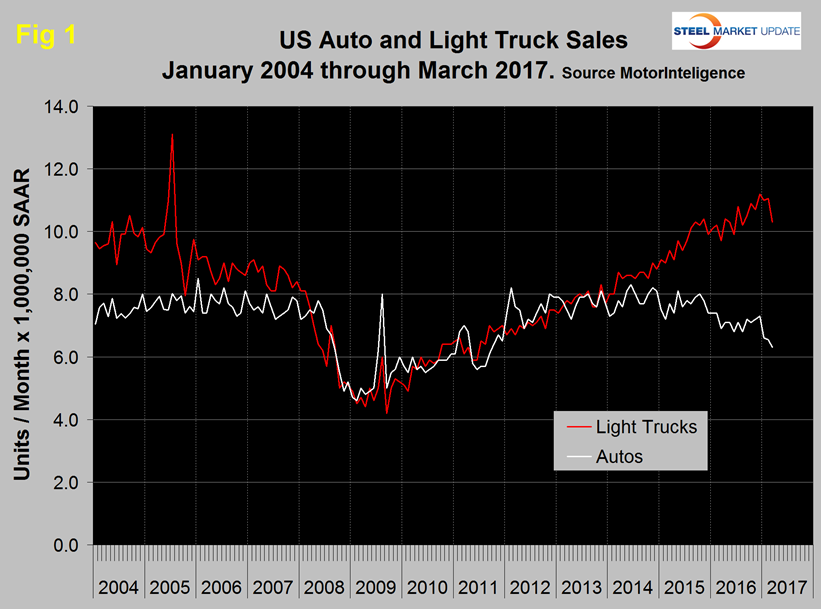
US vehicle sales averaged 17.3 million units, SAAR (seasonally adjusted annual rate) per month in the first quarter, down from 18.1 million in Q4 2016. March sales were much lower than expected with an annualized rate of 16.63 million units, down 0.3 percent year on year. Light-truck sales fell from 11 million annualized units in February to 10.3 million in March. Car sales fell from 6.5 million annualized units in February to 6.3 million in March.
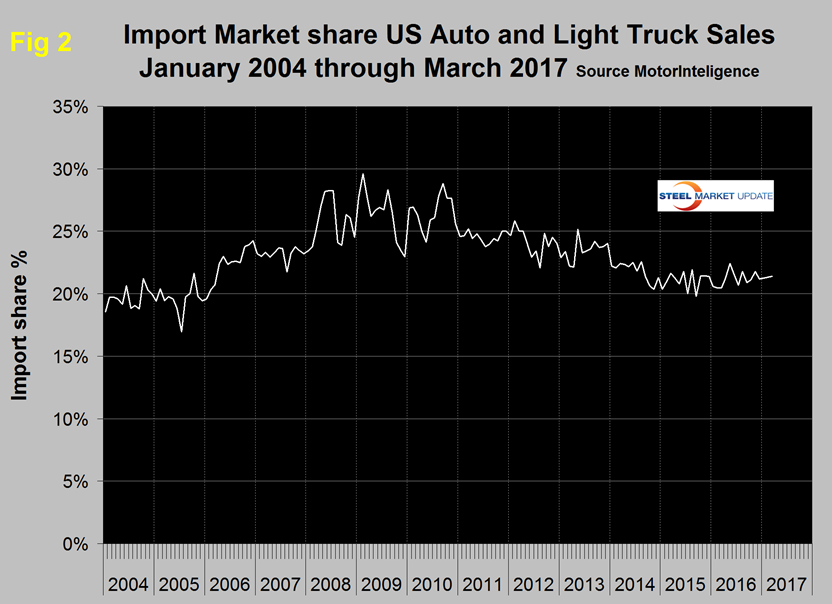
Figure 1 shows auto and light truck sales since January 2004. Import market share at 21.4 percent in March has changed little in the last 18 months as shown in Figure 2.
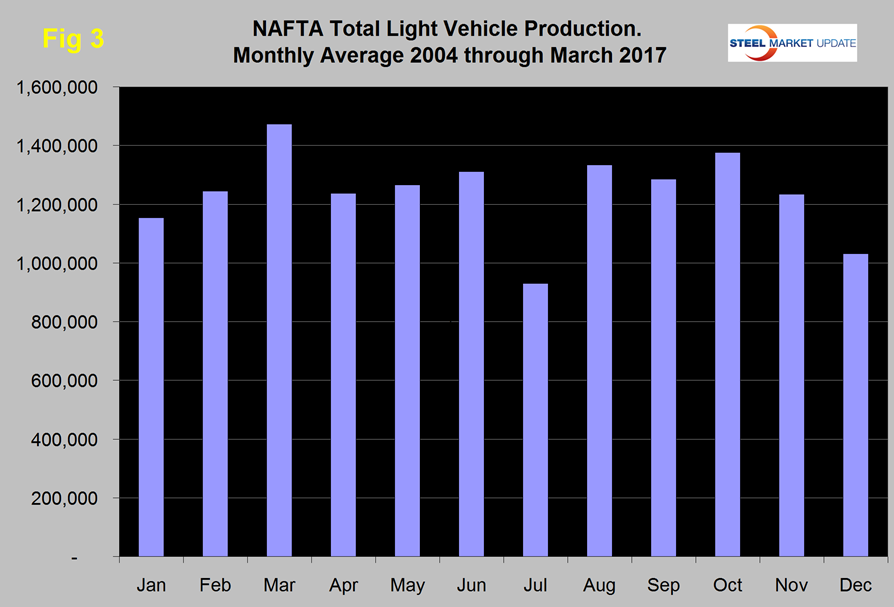
Total light vehicle (LV) production in NAFTA in March was at an annual rate, of 20.073 million units, up from 17.486 in February and 16.641 million in January. This is a normal progression; historically March has been the highest assembly month of the year. On average since 2004, March’s production has been 18.3 percent higher than February. This year production was up by 14.8 percent therefore weaker than normal (Figure 3). We can expect production to decline in April. Note that production numbers are not seasonally adjusted, but the sales data reported above are seasonally adjusted.
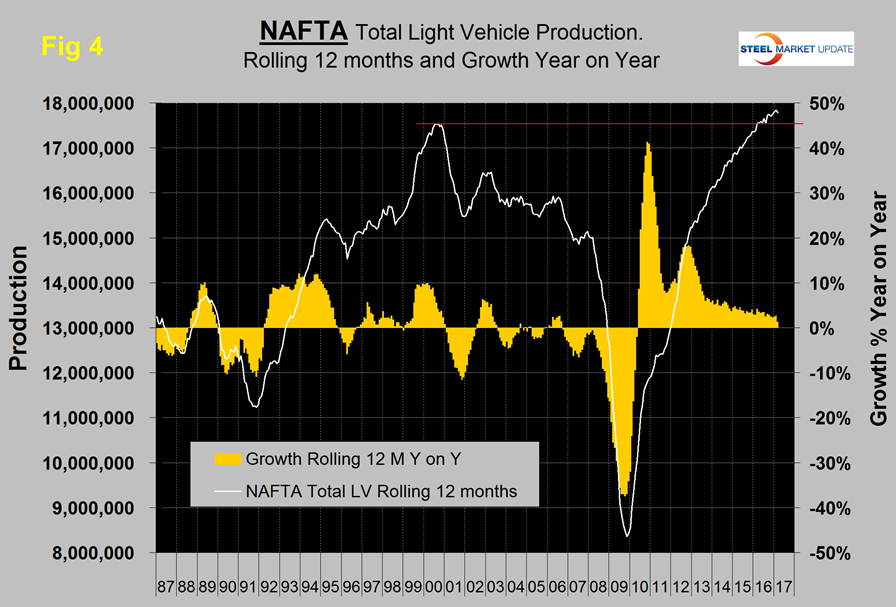
On a rolling 12 months basis y/y through March, LV production in NAFTA increased by 1.3 percent which was down from 2.6 percent in 12 months through February and was the lowest growth rate since May 2010 when the post recession recovery began. There has been a very gradual slowdown in growth for the last three years as indicated by the brown bars in Figure 4; however production has been higher than the previous all time high every month since early 2016.
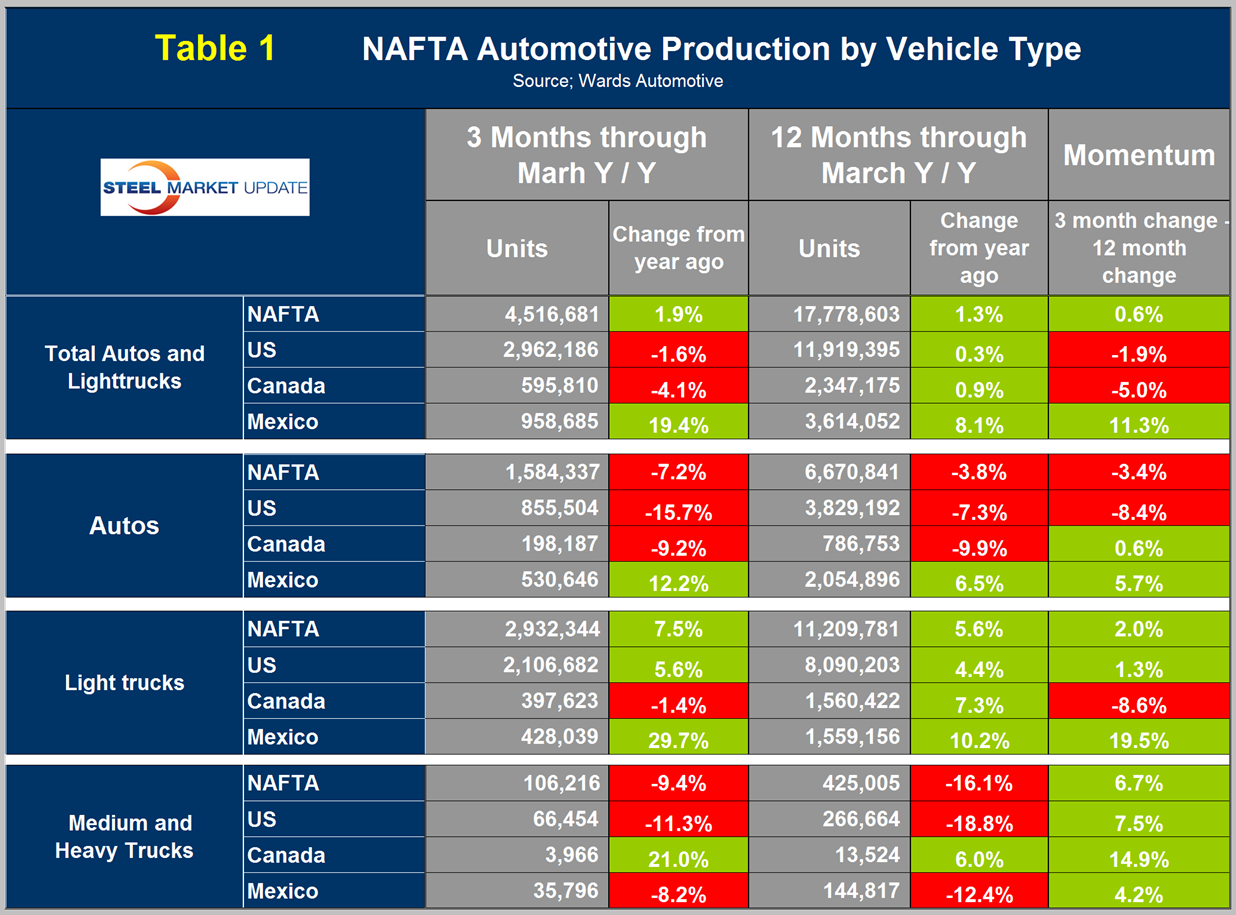
On a rolling 12 months basis y/y the US was up by 0.3 percent with negative momentum, Canada was up by 0.9 percent with negative momentum and Mexico was up by 8.1 percent with very positive momentum (Table 1).
Canada has had negative momentum for nine straight months, and Mexico has been positive every month for the same period. The US has been hovering around neutral for four years. It seems to be true to say that there is a move to shift light vehicle production from Canada to Mexico with the US holding its own. This trend is clear on a rolling 3 months basis y/y in which Mexico surpassed Canada’s share in 2010 and the gap has been widening ever since (Figure 5).
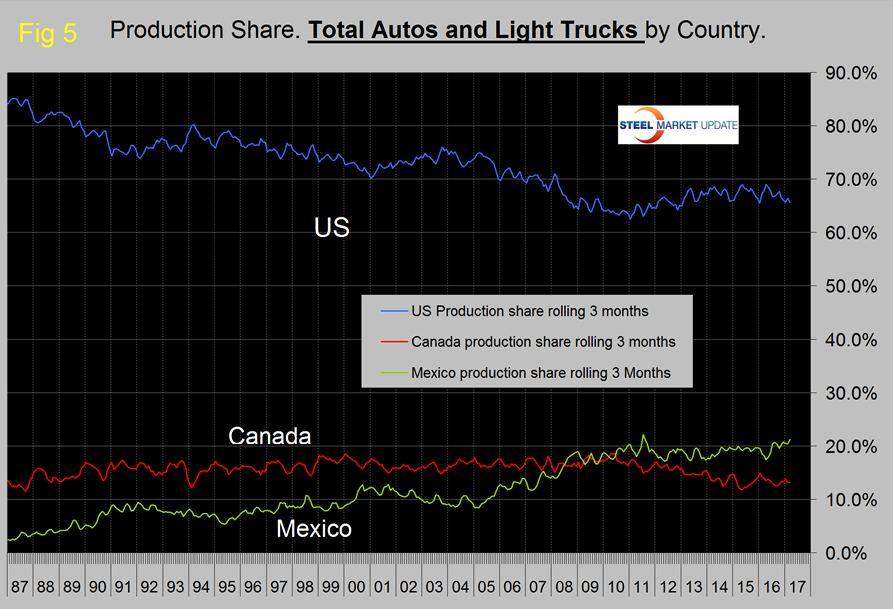
In the short term the Mexican and US shares have been almost mirror images of each other as production has shifted backwards and forwards across the border with not much net change. In March on a rolling three month basis, the US production share of total light vehicles was 65.6 percent, Canada’s was 13.2 percent and Mexico’s was 21.2 percent. The Mexican production target for 2020 is 5.0 million units according to Eduardo Solis, president of the Mexican Automotive Industry Association. This would be up from an average of 3.254 million in the 15 months since January 2016.
Figures 6, 7 and 8 show total LV production by country with y/y growth rates and on each the red line shows the change in production since Q2 2006. Note the scales are the same to give true comparability and that Mexican growth slowed significantly from mid 2015 through mid 2016 and has surged in the last six months.
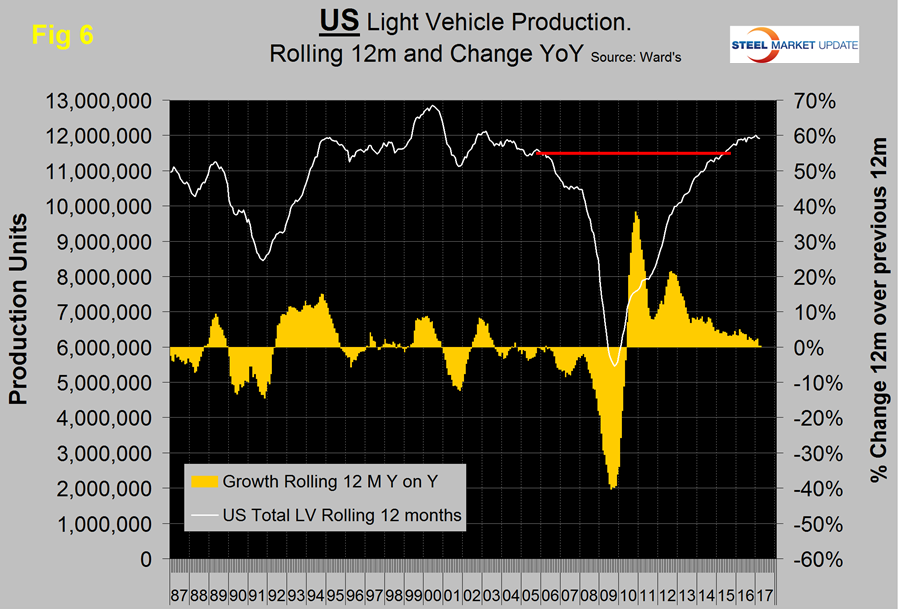
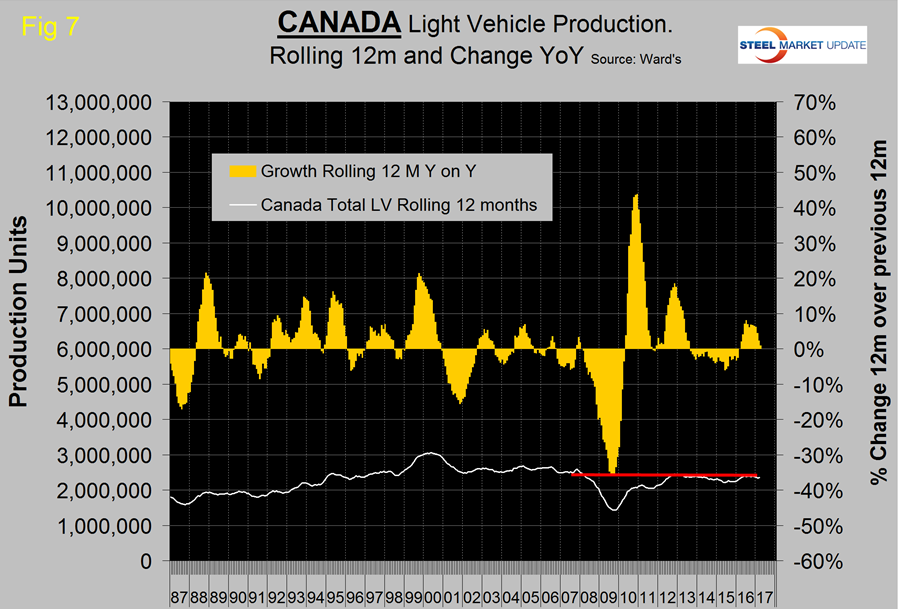
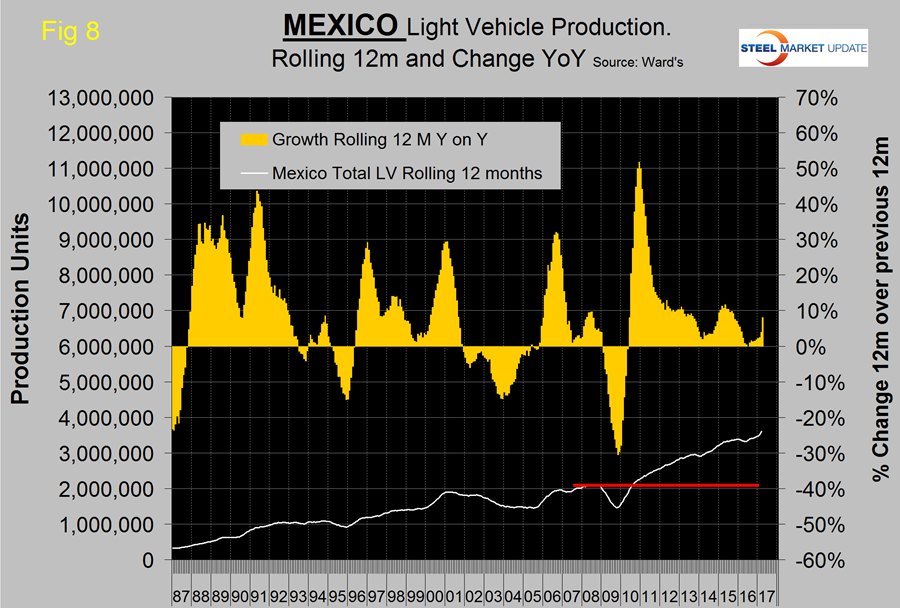
Figure 9 shows that the percentage of autos in the light vehicle mix has been declining for all three countries since 2012, driven by consumer buying preferences which in turn are heavily influenced by gas prices.
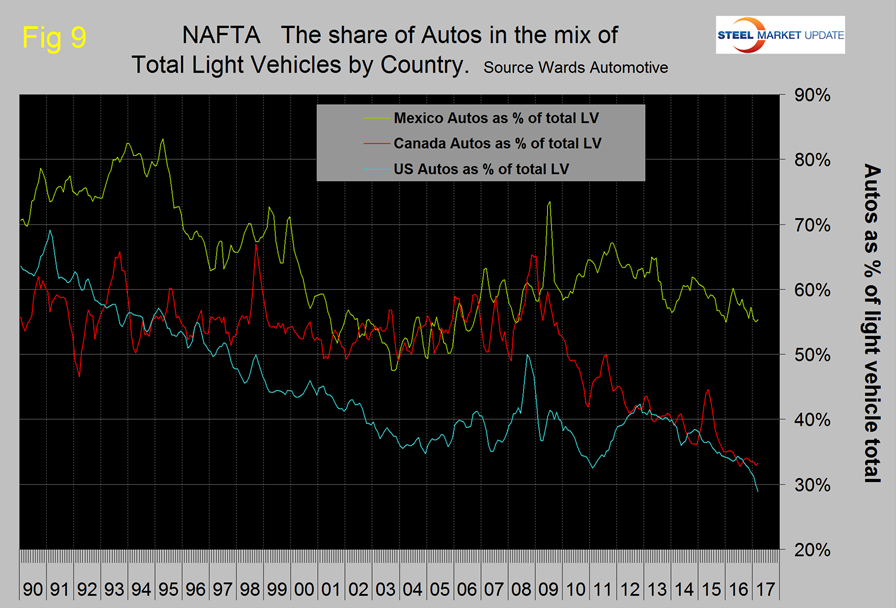
SUVs and crossovers are classified as light trucks which must be the main driver of the shift in mix. The change in preference for light trucks tends to favor the US and Canada over Mexico because the mix of light vehicle production capacity is different by country. The percentage of autos in the Mexican mix in the last three months was 55.4 percent but only 28.9 percent in the US and 33.3 percent in Canada. February and March were the first time for the auto percentage in the US mix to fall below thirty since our data stream began in January 1990. Mexico has staked out a higher relative capacity in autos which will serve it well when gas prices eventually rebound.
Ward’s Automotive reported this week that total light vehicle inventories in the US were 72 days at the end of March, which was down from 74 days at the end of February. Month over month FCA (Fiat Chrysler Automotive) was unchanged at 83, GM was up 7 to 98 and Ford was up 1 to 79 days.
The SMU data file contains more detail than be shown here in this condensed report. Readers can obtain copies of additional time based performance results on request if they wish to dig deeper. Available are graphs of auto, light truck and medium and heavy truck production and growth rate and production share by country.