Analysis

August 22, 2017
Auto Data Reveals Reasons for Concern
Written by Peter Wright
Light vehicle assemblies in NAFTA declined sharply in July, according to data from Ward’s Automotive.
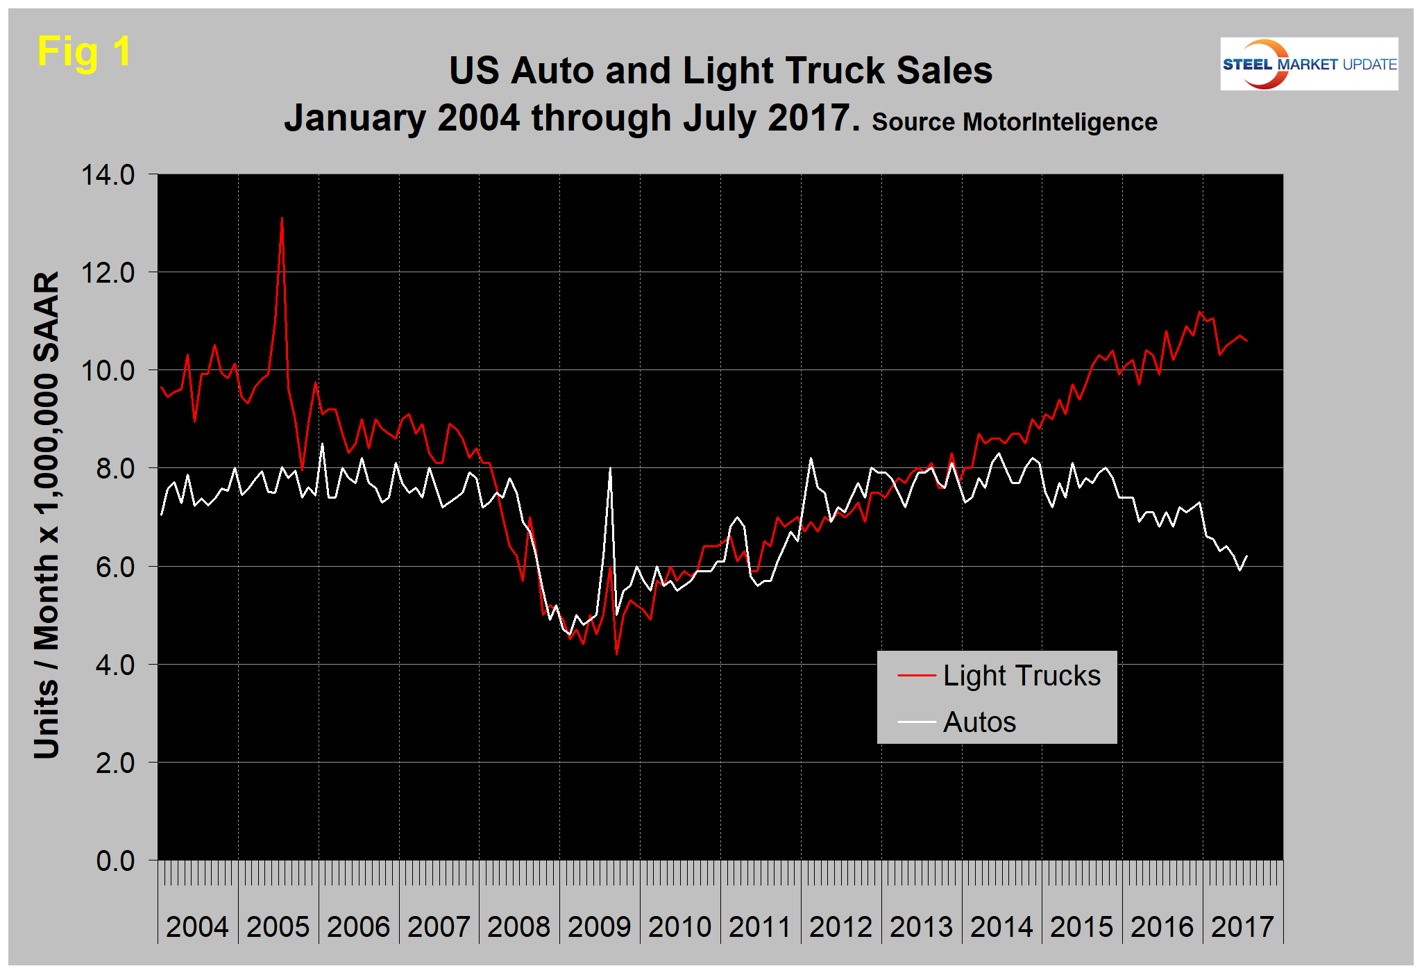
Economy.com reported that U.S. vehicle sales totaled fewer than 17 million units at a seasonally adjusted annualized rate (SAAR) in July for the fifth consecutive month. Sales were 16.76 million units annualized in July, down 5.9 percent on a year-ago basis. Although SUV and crossover sales remain strong, compact and midsize car sales continued to decline. Another source of weakness was fleet sales. Meanwhile, incentive spending hit a July record as automakers are increasingly under pressure to clear remaining inventory.
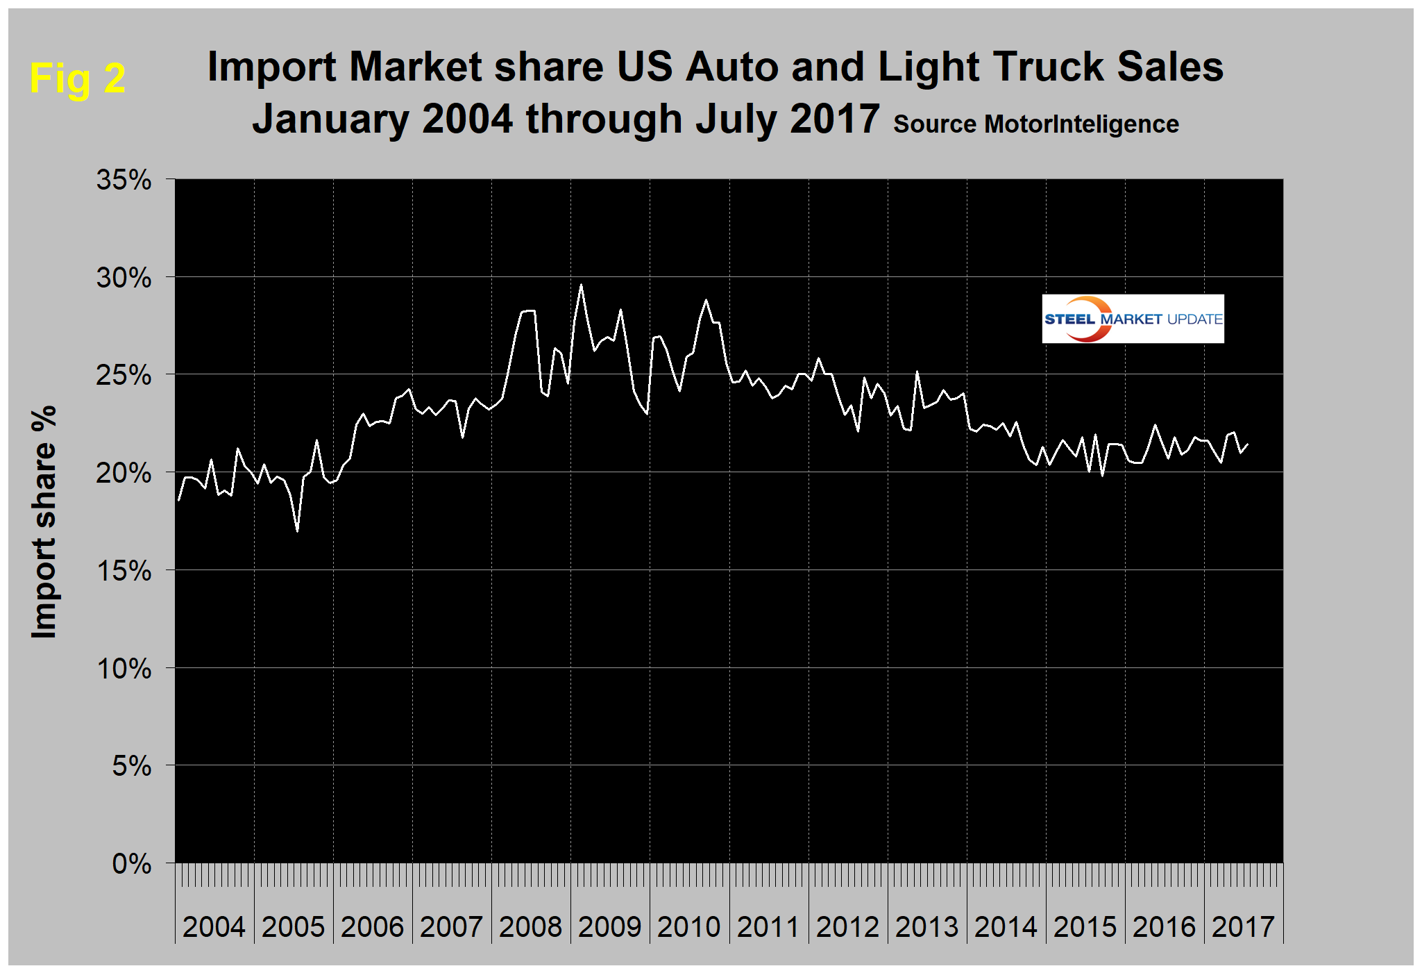
Figure 1 shows auto and light truck sales since January 2004. Import market share at 21.4 percent in July has changed little in the last 18 months as shown in Figure 2.
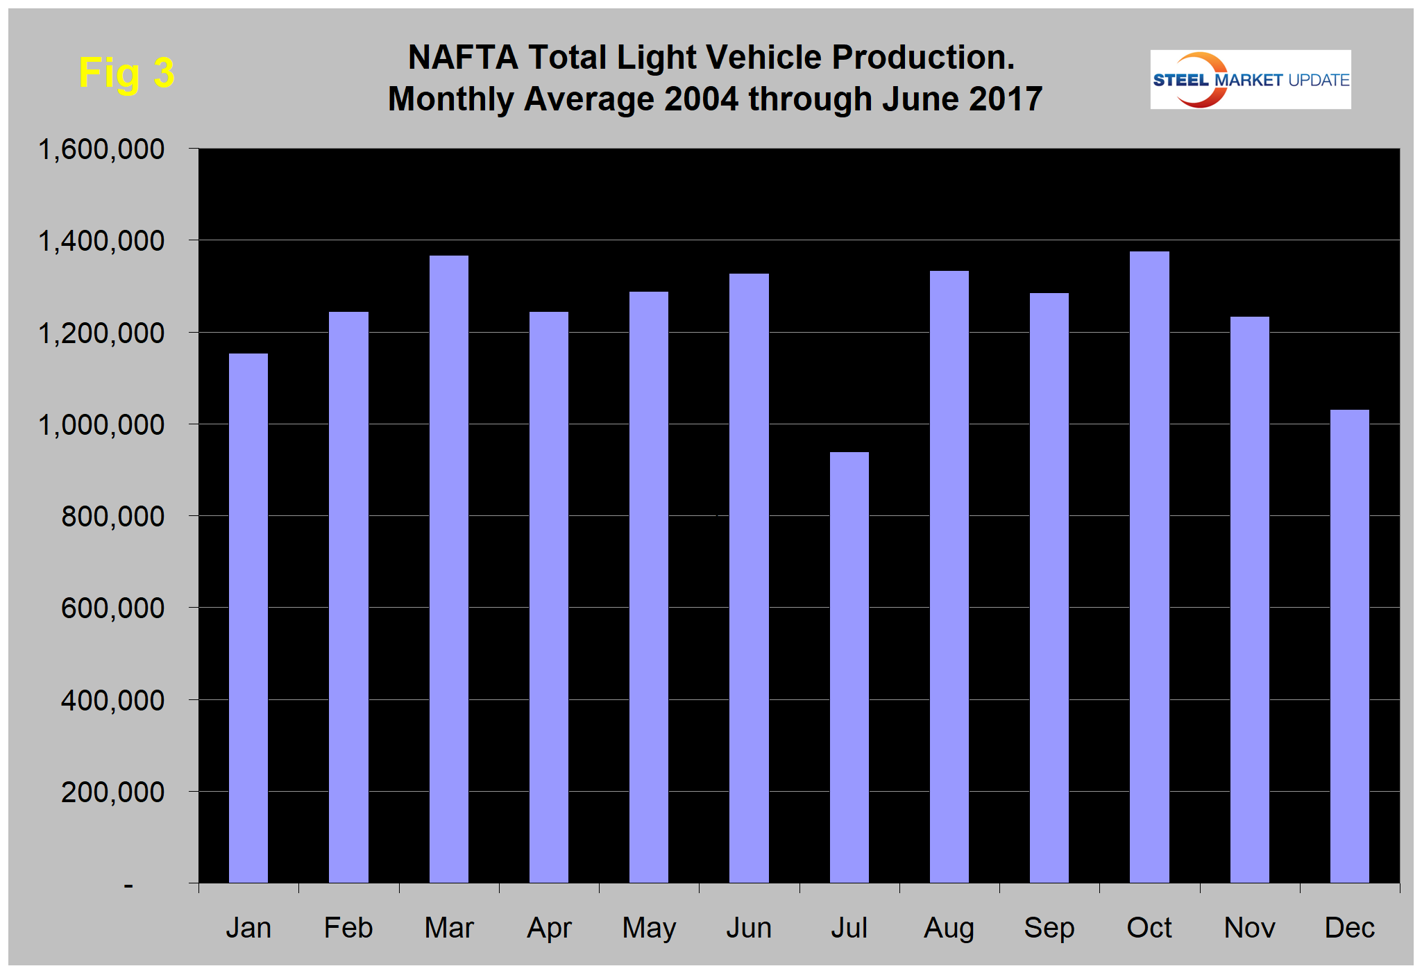
Total light vehicle production in NAFTA in July hit an annual rate of 12.694 million units, down from 18.519 million in June. On average since 2004, July’s production has declined by 29.2 percent from June as the auto companies take their summer maintenance and re-tooling shutdowns. This year production dipped by 31.5 percent, therefore weaker than normal (Figure 3). Year to date through July 2017, production was down by 1.8 percent from the same period in 2016. Note: production numbers are not seasonally adjusted; the sales data reported above are seasonally adjusted. Another consideration to note is that auto assemblies in NAFTA are a complex mix of parts and subassemblies moving both ways between nations and particularly across the southern border. We are reporting on the point of final assembly and have no data to assess how the trade in parts affects the total value mix between nations.
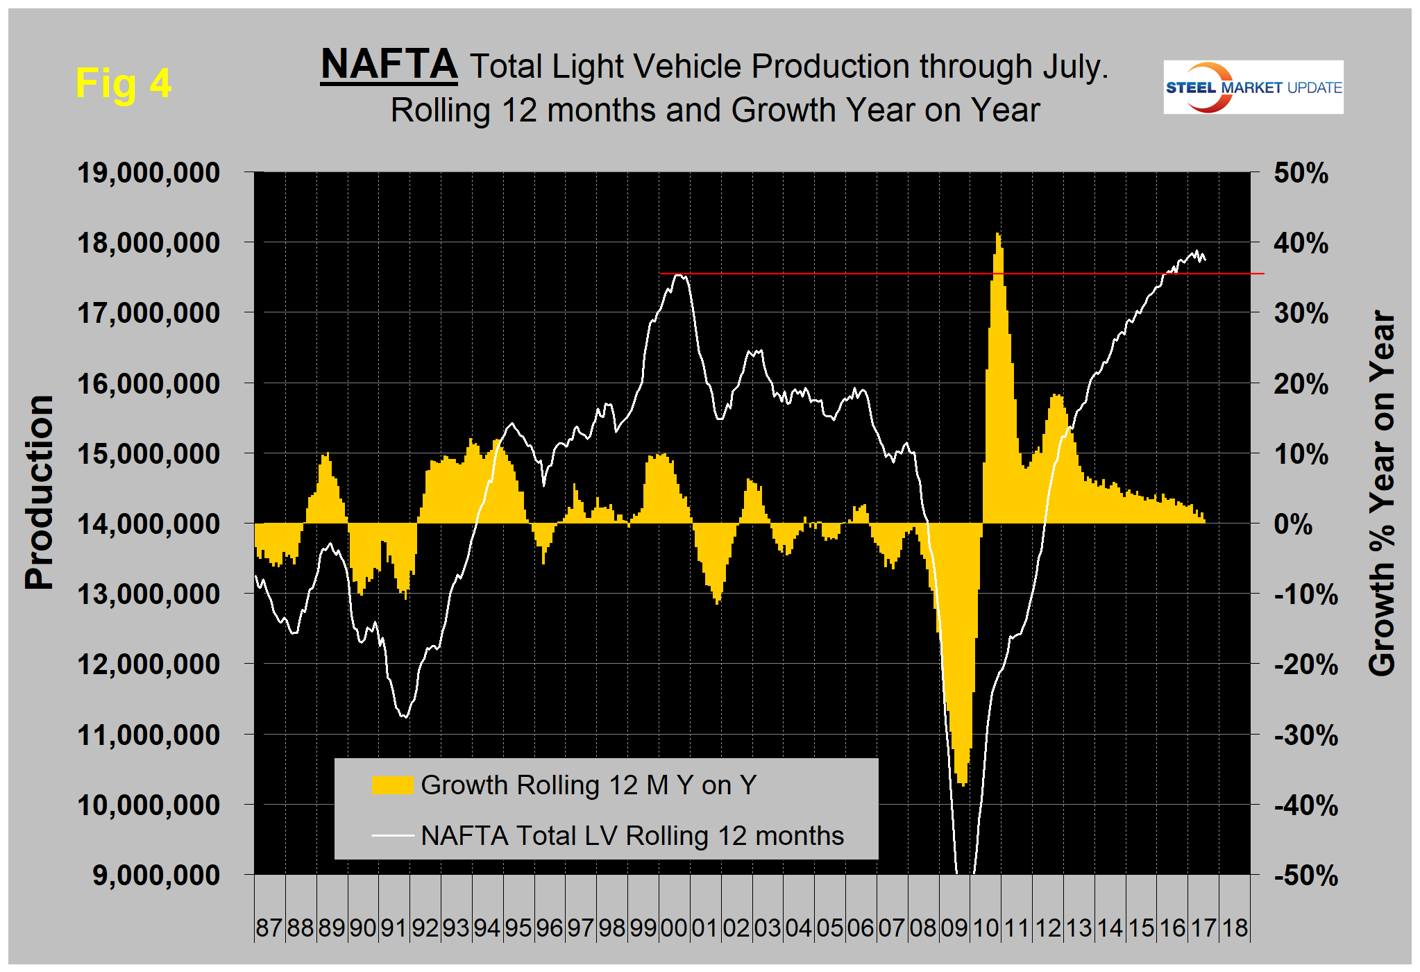
On a rolling 12 months basis year over year through July, light vehicle production in NAFTA increased by 0.5 percent, which was down from the 1.5 percent achieved in 12 months through June. There has been a very gradual slowdown in growth for the last three years as indicated by the brown bars in Figure 4; however, production has been higher than the previous all-time high every month since early 2016.
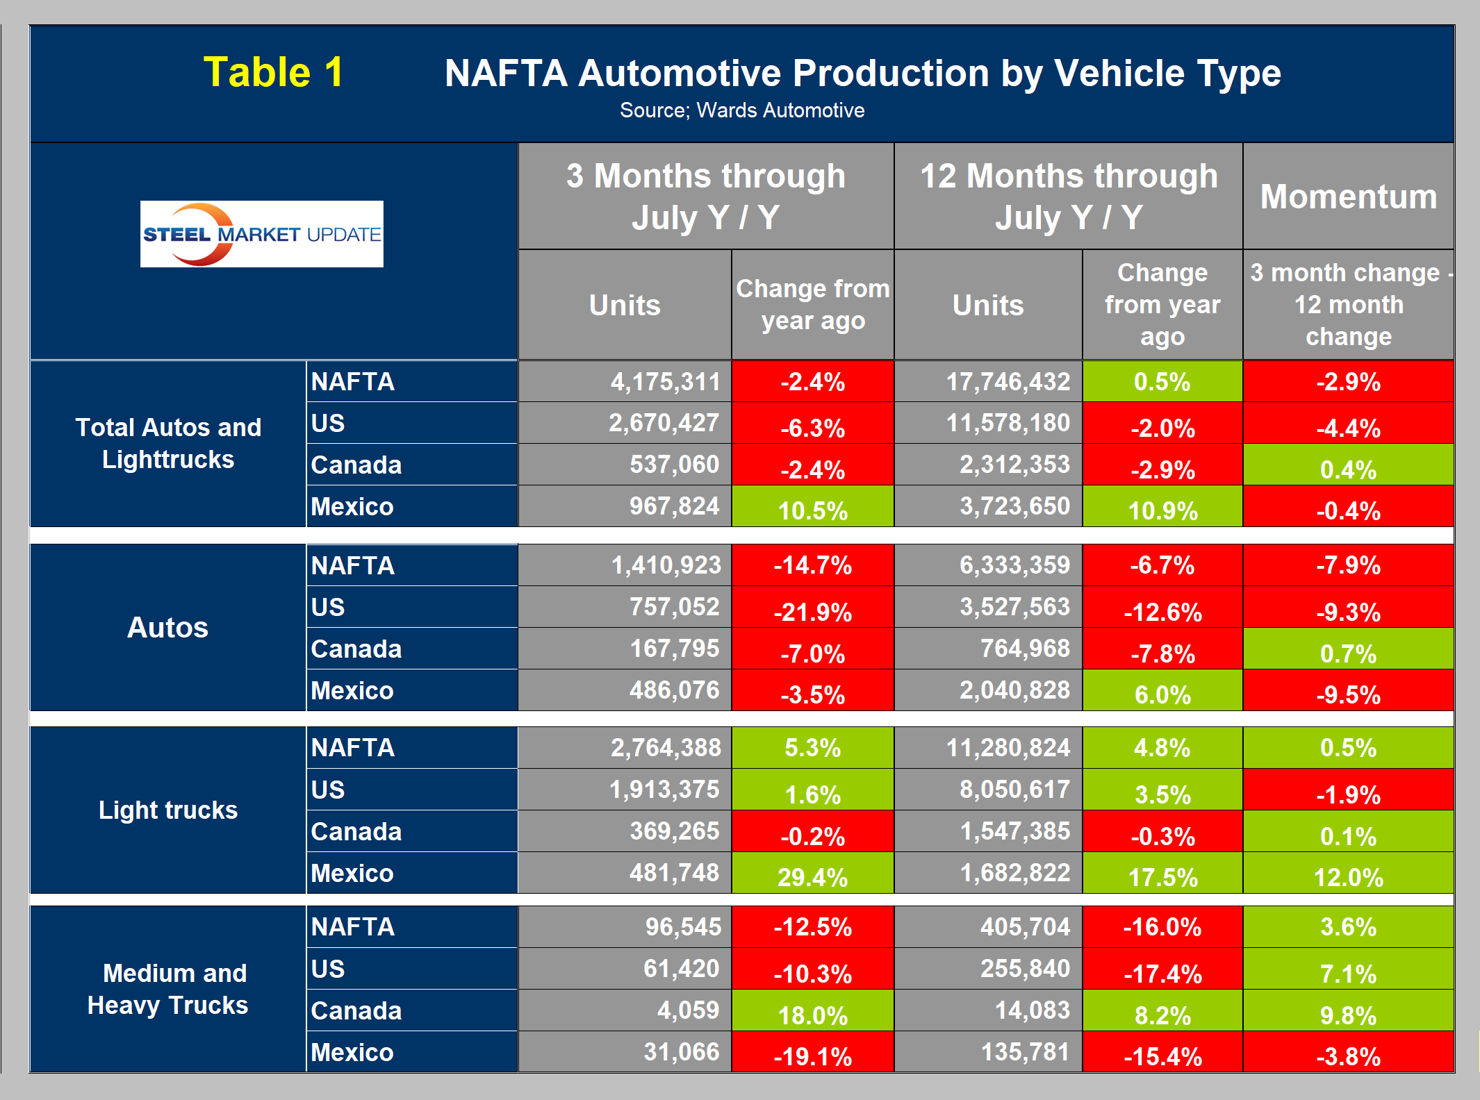
We repeat here what we have been reporting for a while—from the U.S. point of view, the news is not good. It now seems irrefutable that we are amid a huge shift in assembly volume of both autos and light trucks from the U.S. to Mexico, with Canada on the sideline. On a rolling 12 months basis year over year, total light vehicle production in the U.S. declined by 2.0 percent and Canada declined by 2.9 percent, while Mexico increased by 10.9 percent. The comparison is worse for the U.S. comparing the latest three months year over year when volume declined by 6.2 percent in the U.S. and 2.4 percent in Canada, while Mexico grew by 10.5 percent (Table 1). This means the shift south of the border is accelerating.
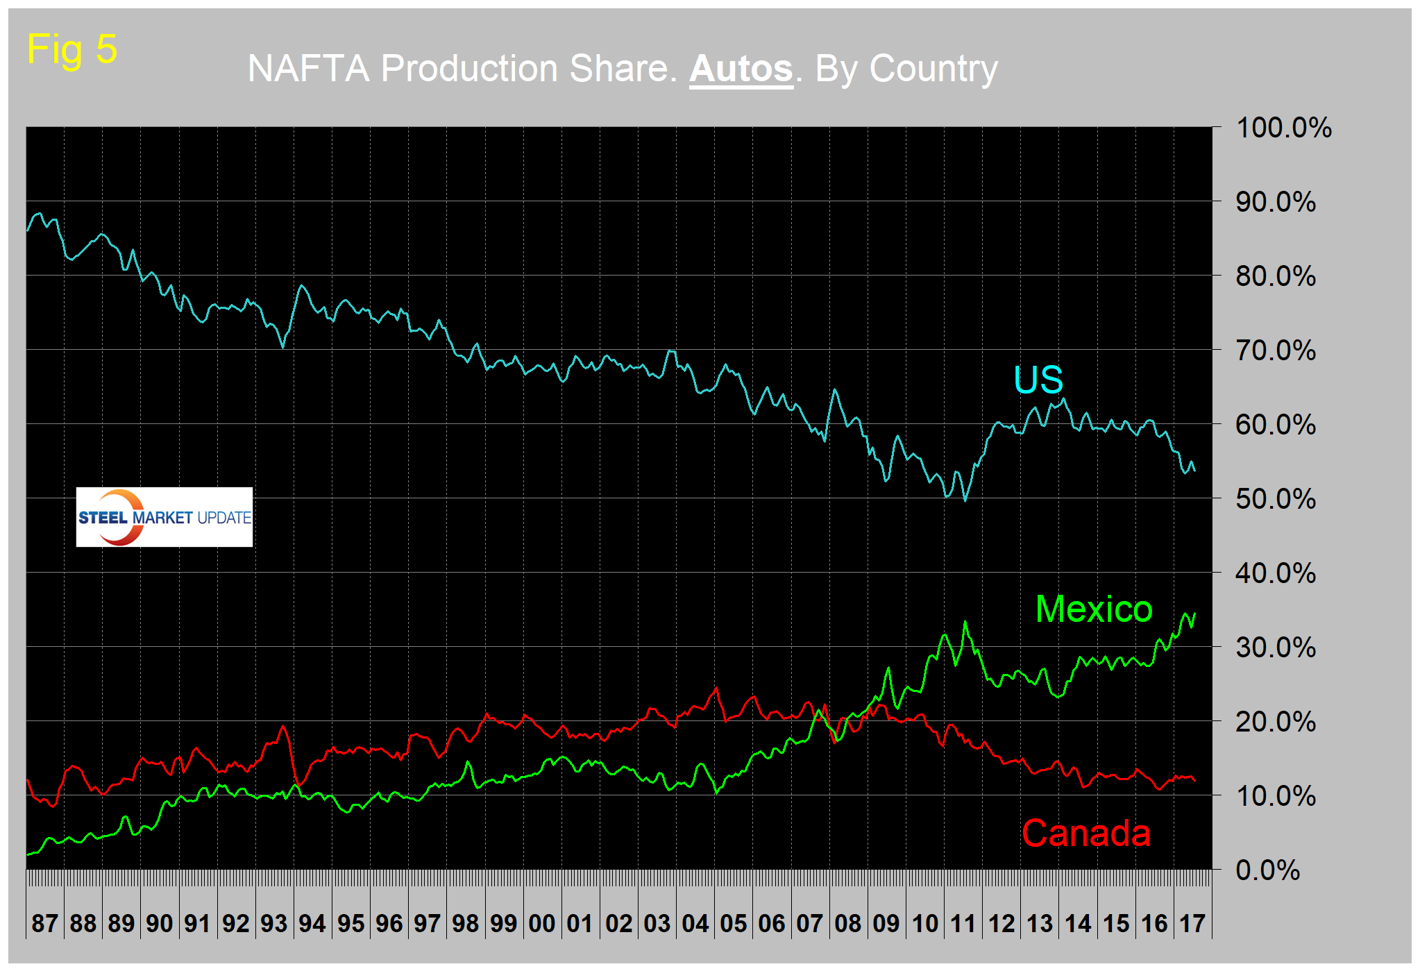
This shift is most pronounced for autos as shown in Figure 5. The U.S. now has a market share in autos of 53.7 percent, versus Mexico’s 34.5 percent and Canada’s 12.8 percent.
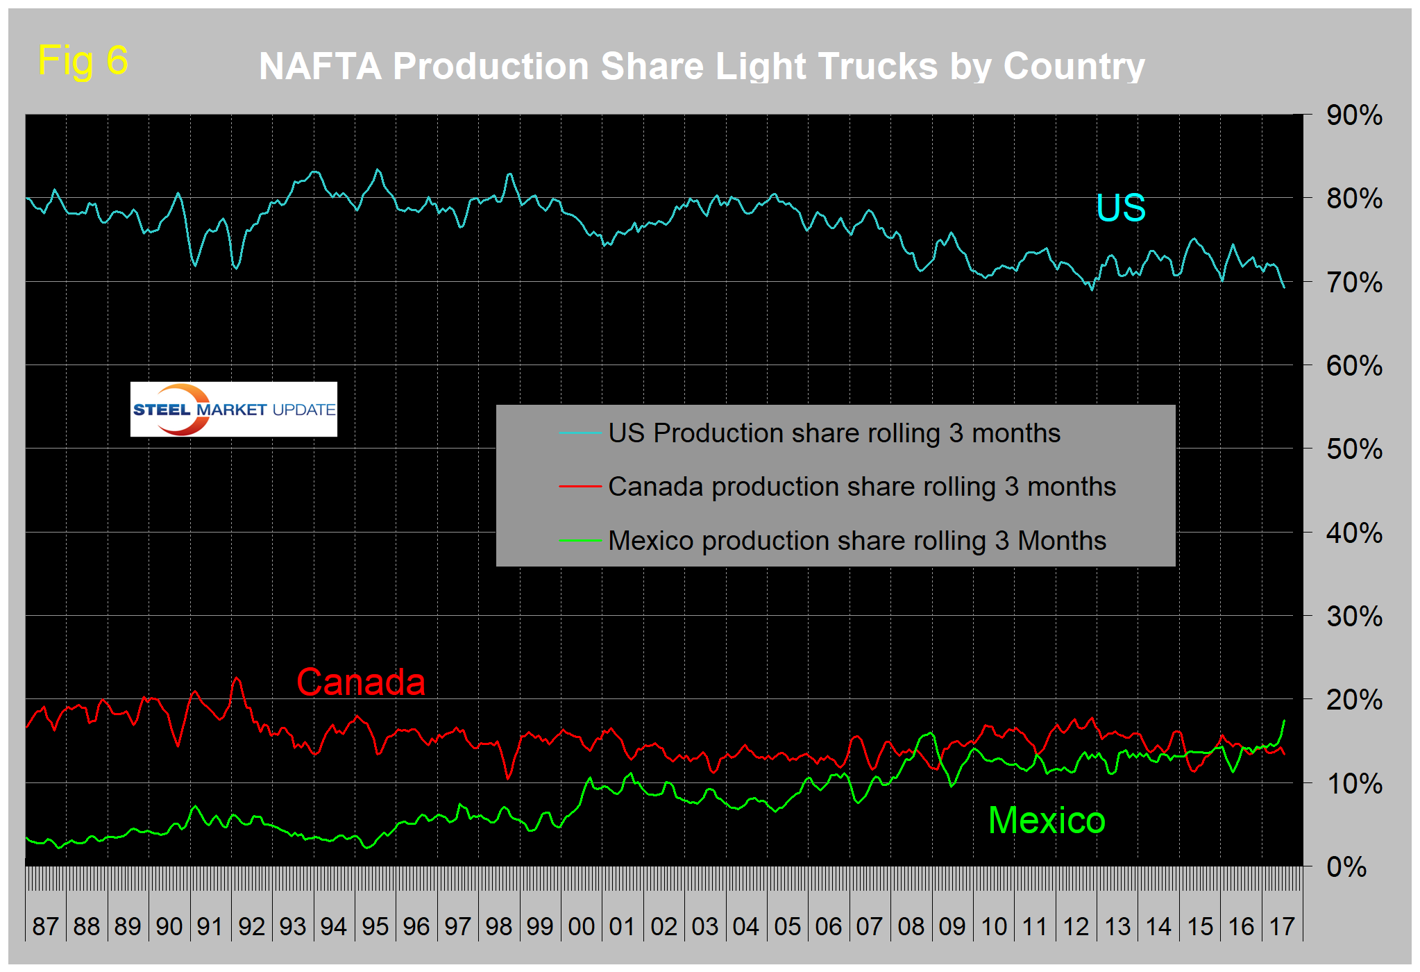
Up until this year, the U.S. market share of light trucks hadn’t changed much since mid-2009. But in 2017, there has been a sharp increase in Mexico’s share at the expense of the U.S., with Canada little changed (Figure 6). The U.S. share is now 69.2 percent, Mexico’s is 17.4 percent and Canada’s is 13.4 percent. In three months through July year over year, Mexico’s production of light trucks grew by 29.4 percent. The U.S. grew by 1.6 percent and Canada contracted by 0.2 percent.
The Mexican light vehicle production target for 2020 is 5.0 million units, according to Eduardo Solis, president of the Mexican Automotive Industry Association. This would be up from an average of 3.553 million in the 18 months since January 2016. Considering all the talk about renegotiating the terms of NAFTA, we wonder if the auto companies are trying to stake out a stronger position in Mexico before the deal is done. This is pure speculation on our part.
Figures 7, 8 and 9 show total light vehicle production by country with year-over-year growth rates as the brown bars. The red line on each chart shows the change in production since Q2 2006. Note the scales are the same to give true comparability and that Mexican growth has surged in 2017.
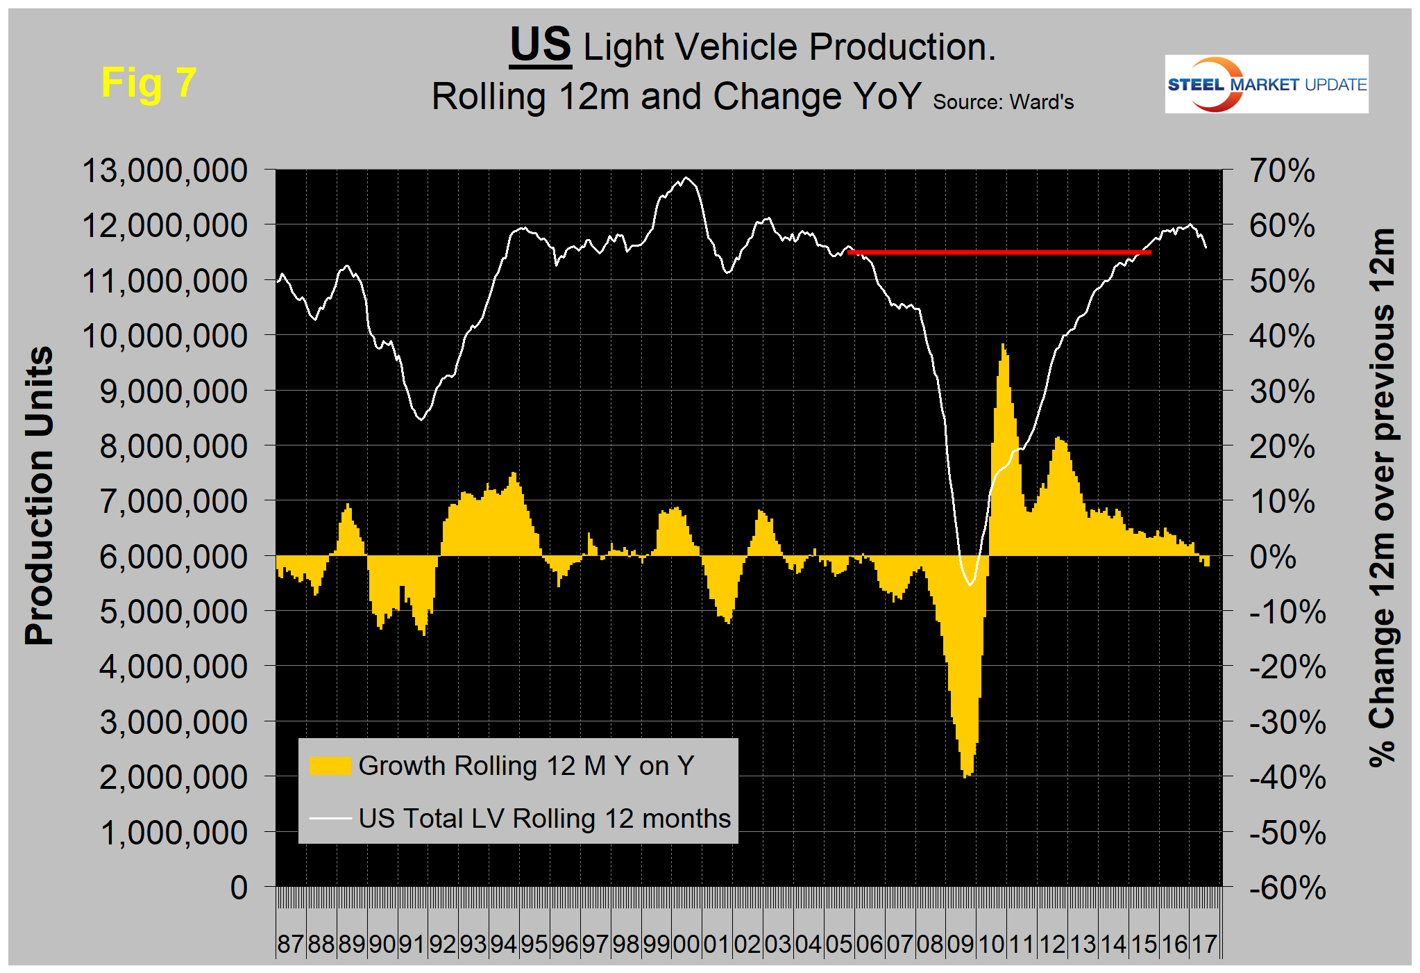
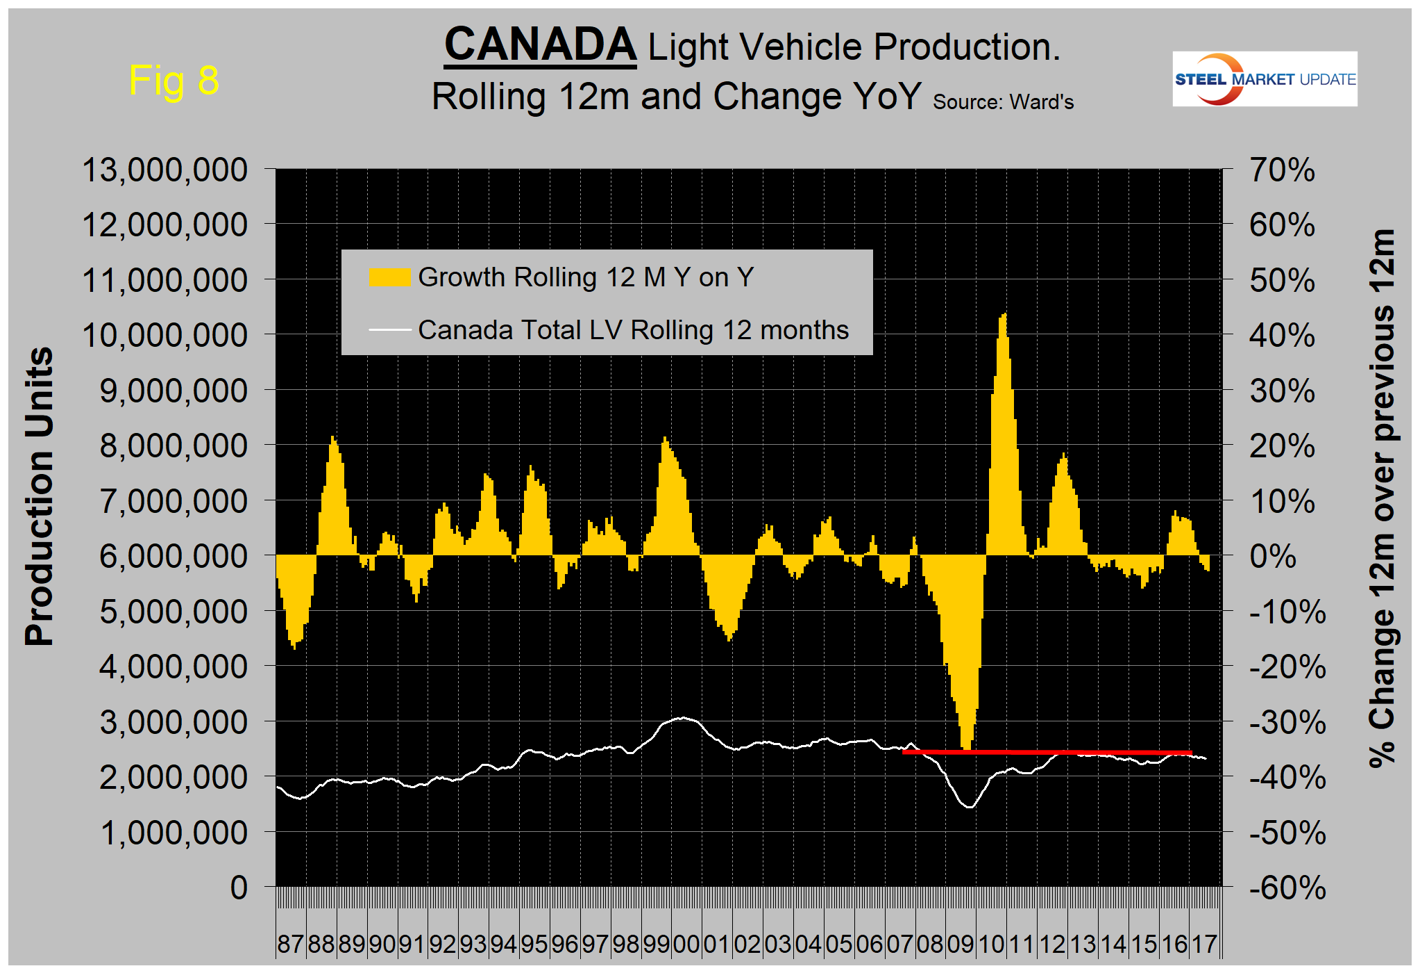
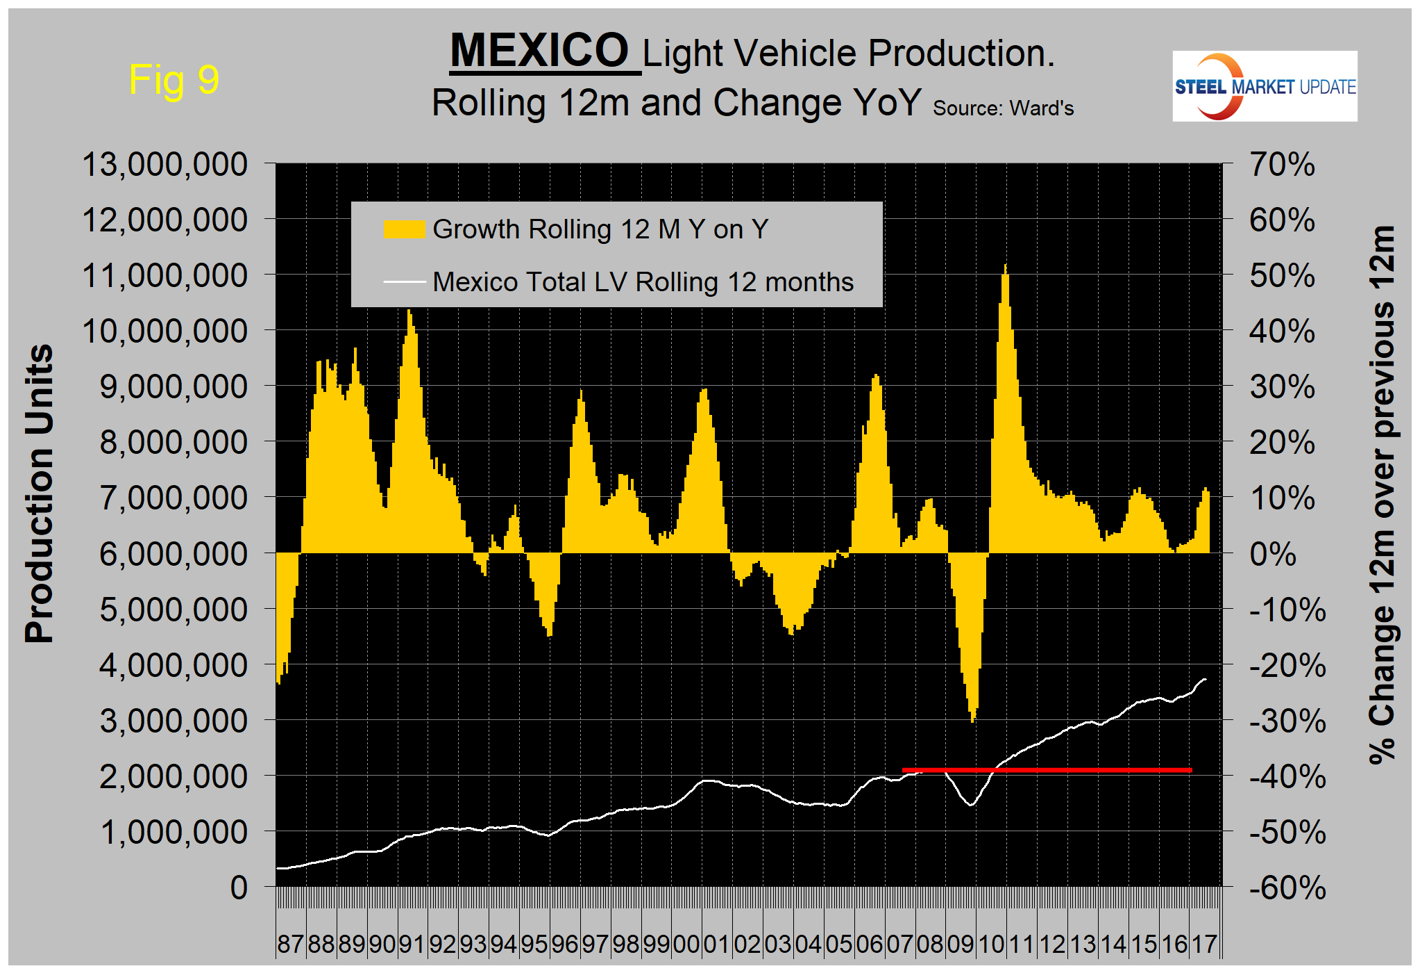
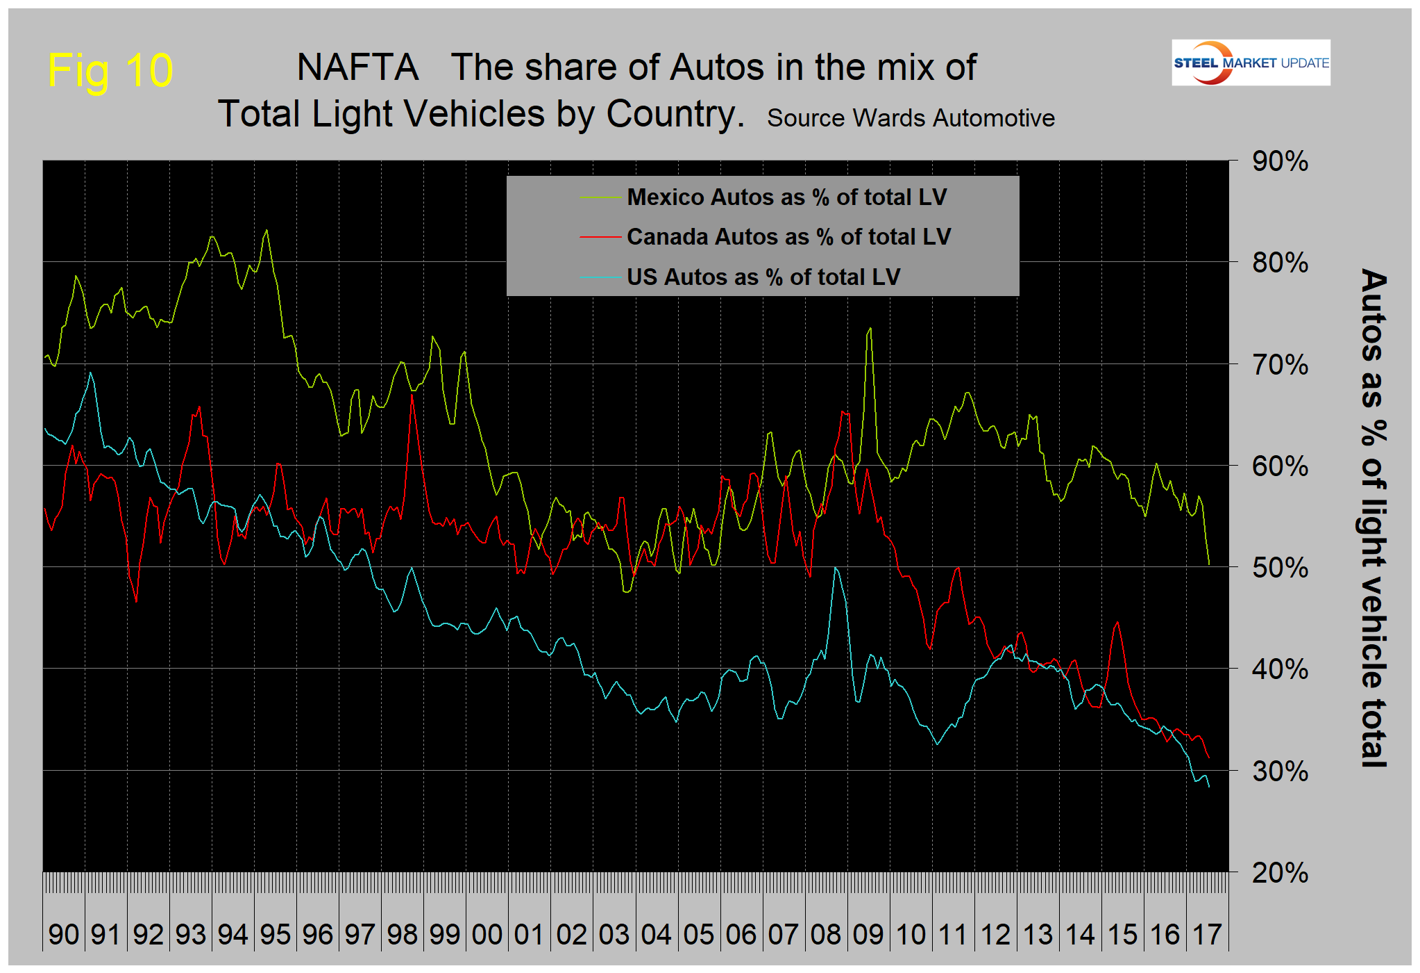
Figure 10 shows that the percentage of autos in the light vehicle mix has been declining for all three countries since 2012, driven by consumer buying preferences, which in turn are heavily influenced by gas prices. SUVs and crossovers are classified as light trucks, which is the main driver of the shift in mix. The change in preference for light trucks has tended to favor the U.S. and Canada over Mexico since the recession because the mix of light vehicle production capacity is different by country. This could be changing since Mexico is now producing 50:50 autos and light trucks. This is the lowest proportion of autos in the Mexican mix since early 2005. February through July was the first time for the auto percentage in the U.S. mix to fall below 30 percent since our data stream began in January 1990.
Ward’s Automotive reported this week that total light vehicle inventories in the U.S. were 69 days at the end of July, down from 74 days at the end of June. Month over month, FCA’s (Fiat Chrysler Automotive) inventory rose from 71 to 74 days, GM was down one to 104 days and Ford was down 3 to 76 days. To put those results into perspective, Toyota was down 14 to 50 days. Figure 11 shows that inventory days of sales in the U.S. has exhibited an increasing trend since Q2 2015. 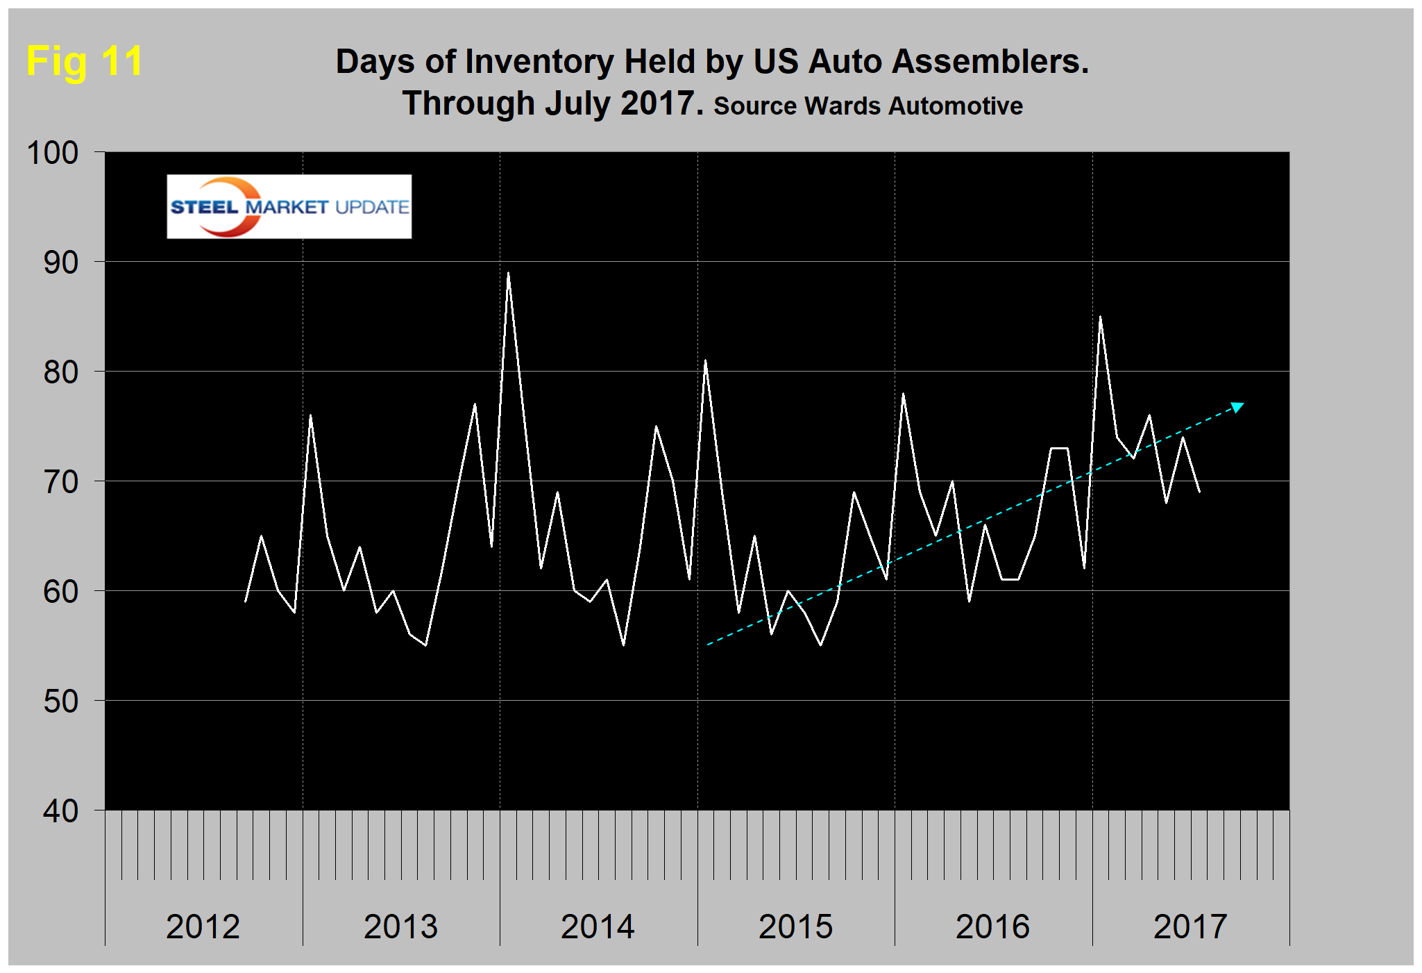
The SMU data file contains more detail than can be shown here in this condensed report. Readers can obtain copies of additional time-based performance results on request if they wish to dig deeper. Available are graphs of auto, light truck, medium and heavy truck production. Also, growth rates and production share by country.