

Market Data

August 27, 2017
Indicators Mostly Positive for U.S. Manufacturing
Written by Peter Wright
U.S. manufacturing continued to perform well through July.
This Premium content, which is being offered to all subscribers, summarizes seven data sources that describe the state of manufacturing in the U.S. We have reported on most of these separately in our Steel Market Update publications, therefore will be brief in this summary. We don’t expect these data sources to all point in the same direction. Our intention in summarizing them in one document is to provide a consensus of the state of this critical steel consumption sector.
The Industrial Production Index: Figure 1 shows the IP index since January 2007 with the year-over-year growth. The three-month moving average (3MMA) had negative growth every month from October 2015 through December 2016 as shown by the brown bars in Figure 1.
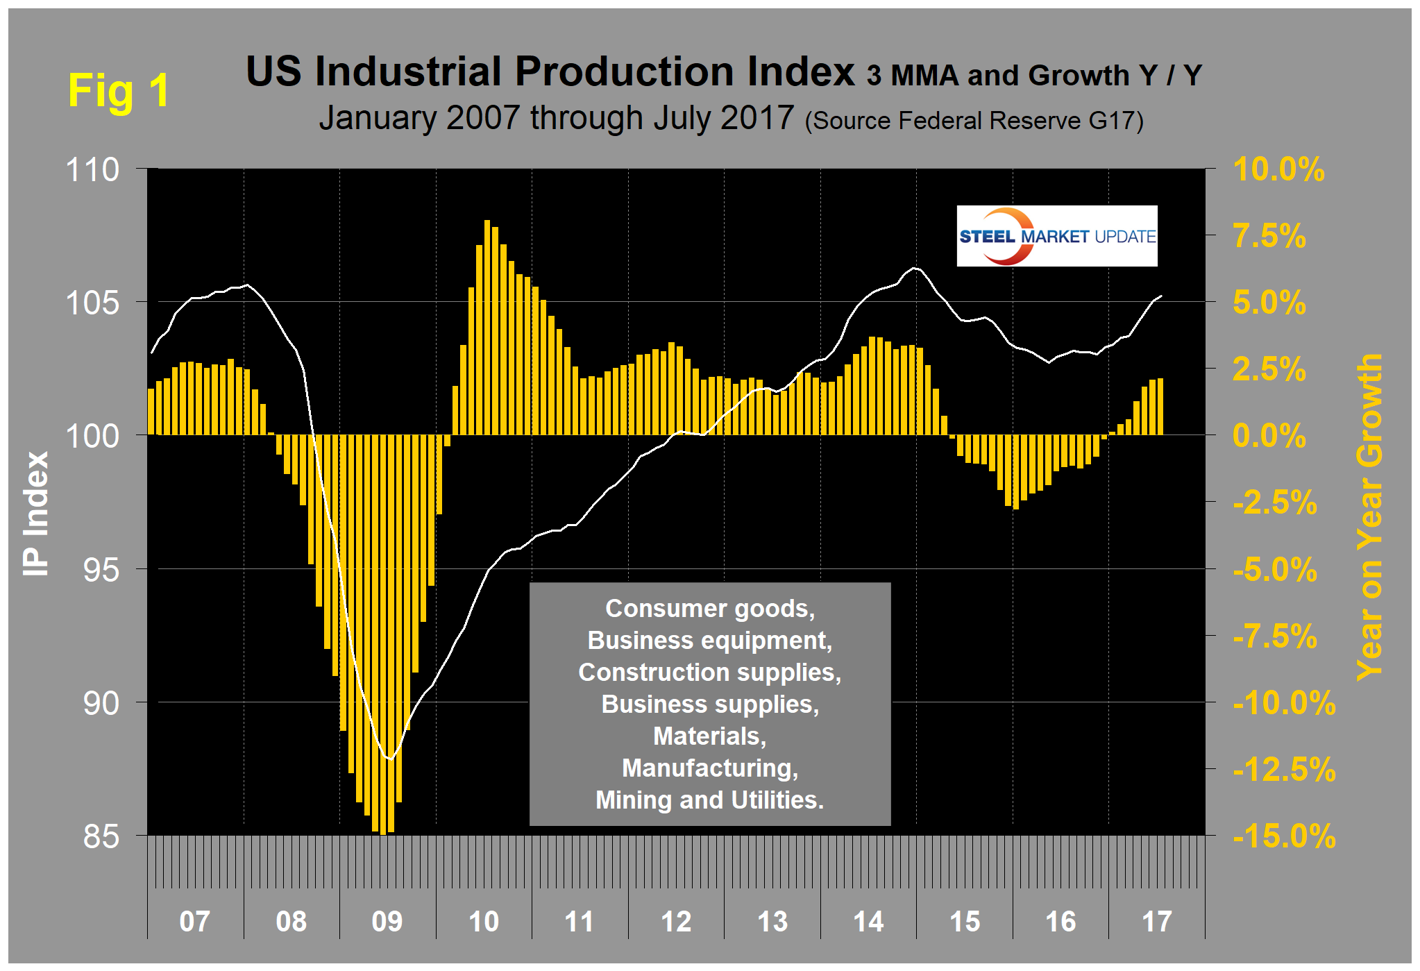
There was a decrease in negativity throughout 2016. January this year was the first month of positive growth in the 3MMA since September 2015. Growth improved in each of the 10 months through July 2017 from negative 1.24 percent in September last year to positive 2.12 percent in July this year.
New Orders for Durable Goods: The U.S. Census Bureau announced on Friday that new orders for manufactured durable goods in July decreased $16.7 billion or 6.8 percent to $229.2 billion. This decrease, down three of the last four months, followed a 6.4 percent June increase. Excluding transportation, new orders increased 0.5 percent. Excluding defense, new orders decreased 7.8 percent. Transportation equipment, also down three of the last four months, drove the decrease by $17.4 billion or 19.0 percent to $74.3 billion.
At SMU, our take on this is somewhat more positive because we think it’s necessary to look at a 3MMA to get a more realistic picture. Figure 2 shows the 3MMA of monthly orders for durable goods since January 2010 with the percent change year-over-year.
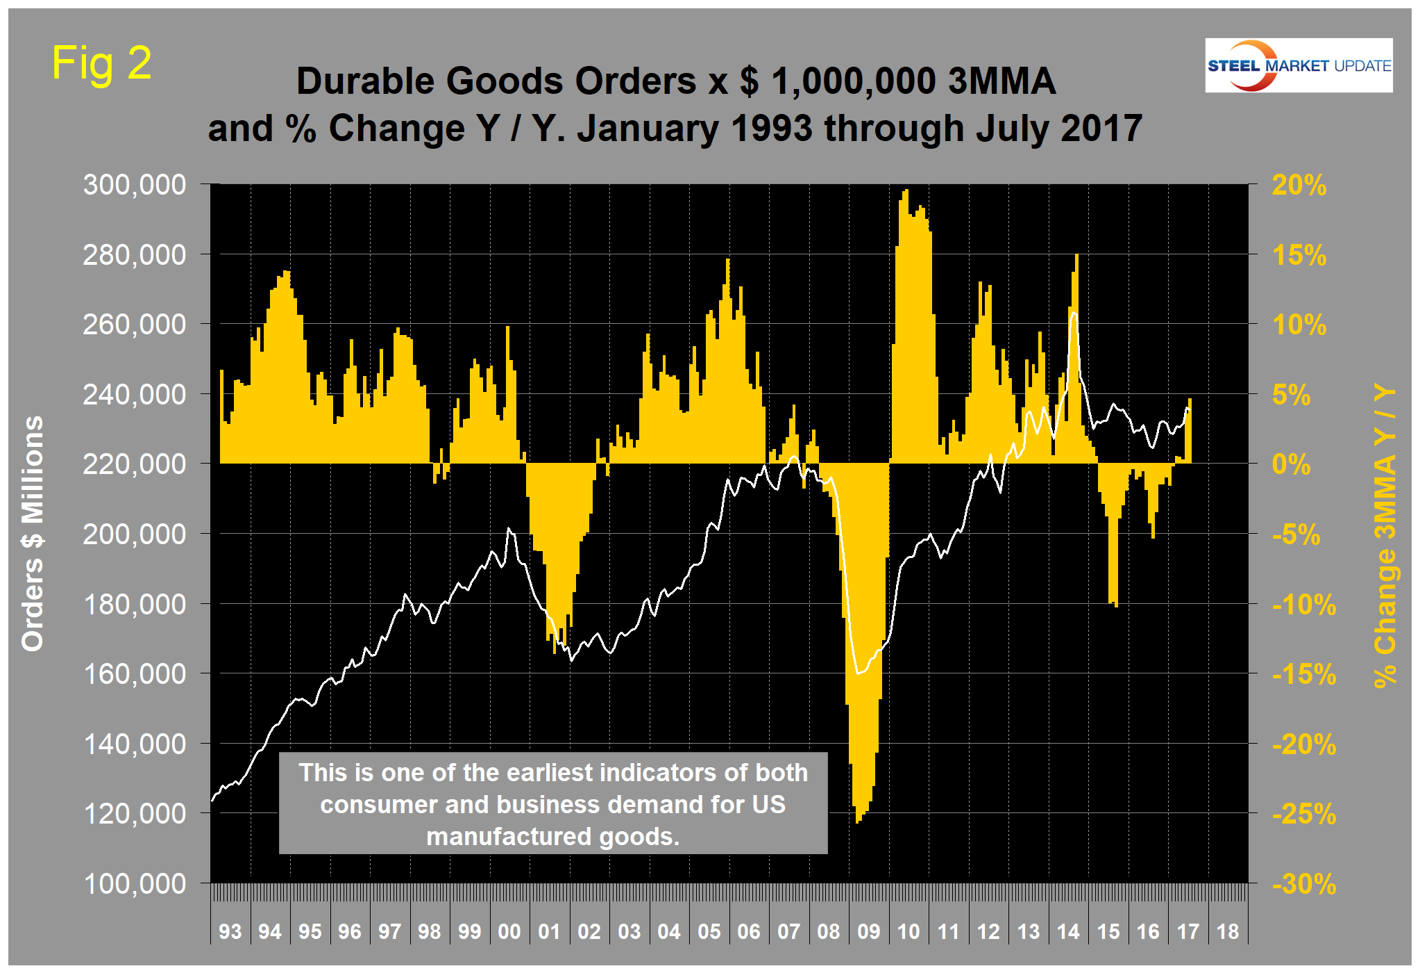
The abnormal peak of August 2014 was a surge in civil aircraft orders. November 2016 was the first month since April 2015 to have positive year-over-year growth. There has been an improving trend since September 2015 with a positive surge in the most recent data for June and July this year.
The Durable Goods Portion of GDP: The first estimate of Q2 GDP was released late last month. A sub-component of the quarterly data is durable goods, which is part of the personal consumption calculation. It therefore contains no military hardware or civil aircraft data. This is shown in Figure 3 and presumably because of the exclusions just mentioned looks nothing like Figure 2.
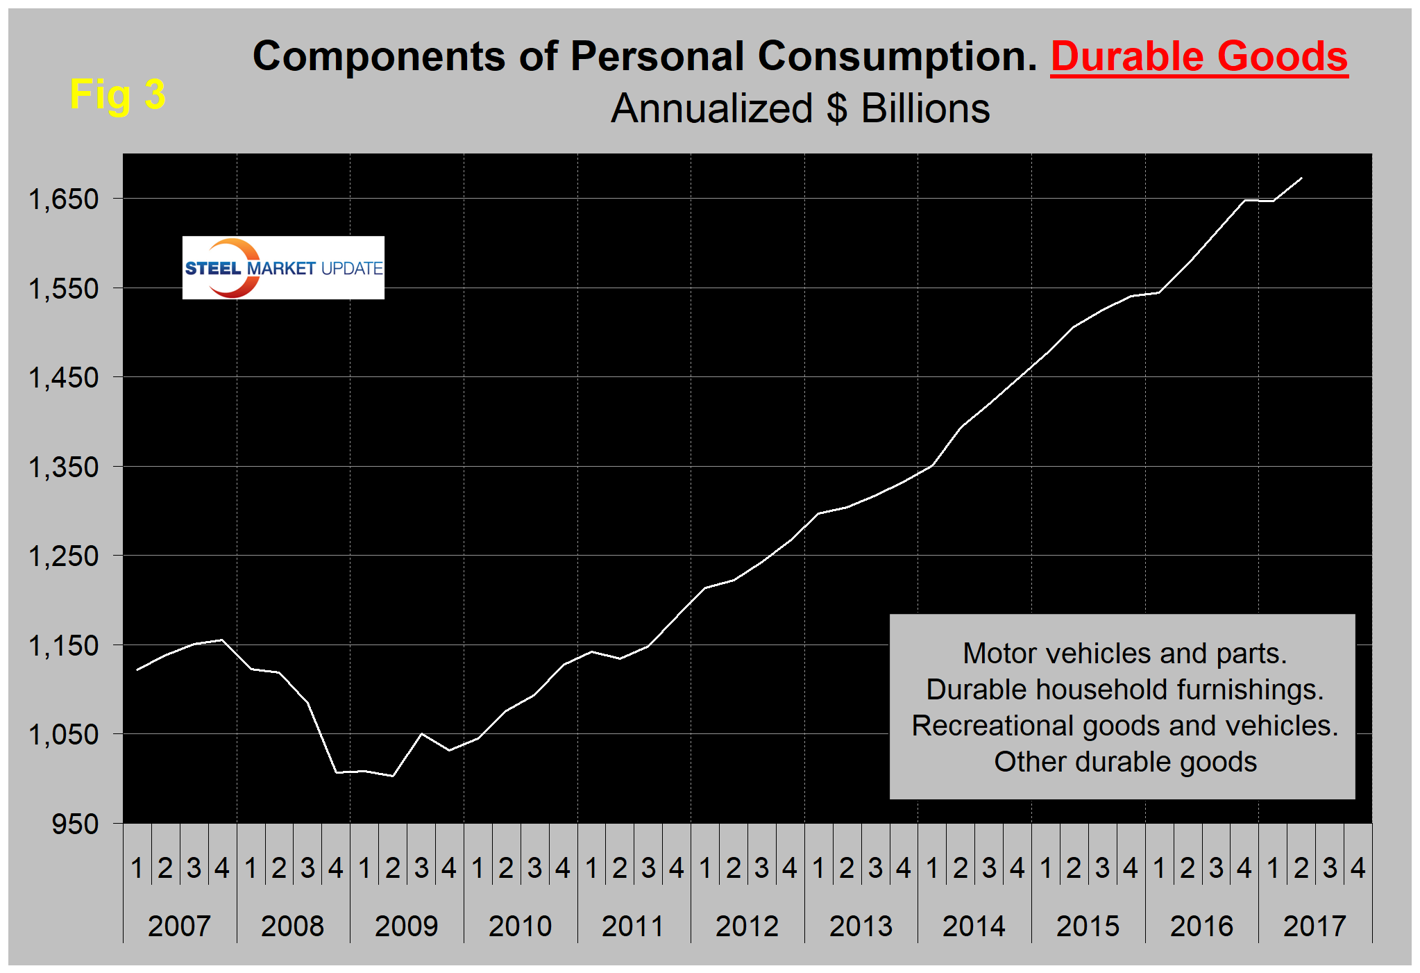
Durable goods manufactured for personal consumption have been on a healthy growth curve ever since the end of the recession with hesitations in the first quarters of 2016 and 2017.
Light Vehicle Production: Light vehicle production in NAFTA declined by 2.4 percent in three months through July year-over-year. Assemblies in the U.S. declined by 6.5 percent, but in Mexico increased by 10.5 percent. Mexico has been taking share from the U.S. for over a year; also from Canada to a lesser extent. Figure 4 shows light vehicle production in the U.S. on a rolling 12-month basis with the year-over-year growth rate.
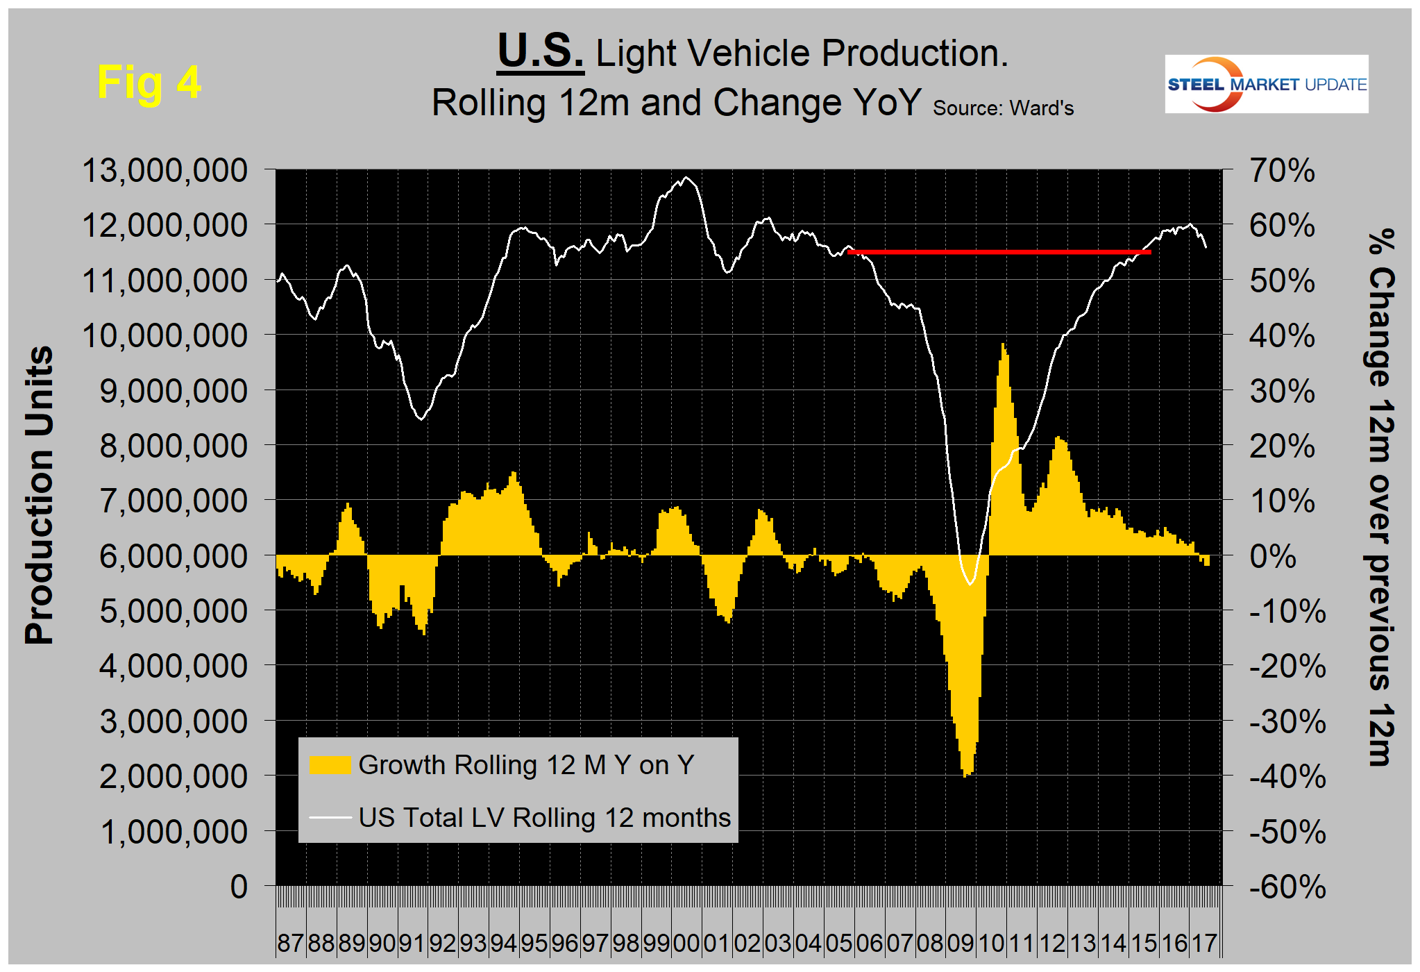
Growth has been negative in the U.S. every month in the period April through July this year. This data comes from Ward’s Automotive. There is a huge movement of components and subassemblies in both directions across the southern border, therefore it is not known whether the Ward’s data exaggerates or deflates the national differentials.
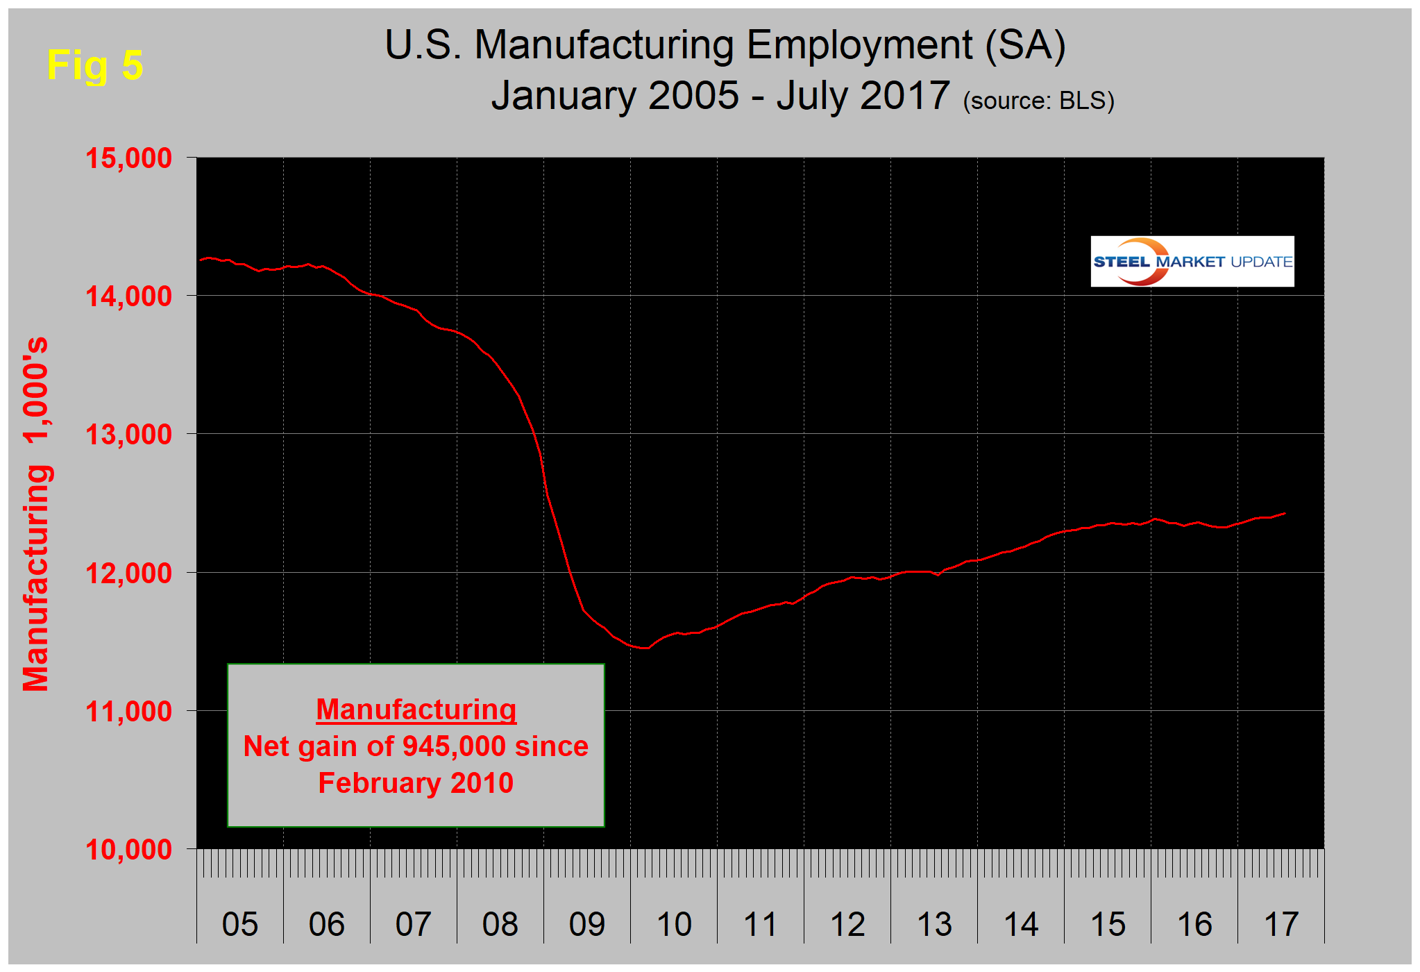
Manufacturing Employment: Manufacturing employment nosedived during the recession and gradually improved from the spring of 2010 through 2014. Growth was flat in 2015 and declined slightly in 2016 when 23,000 jobs were lost during the year. There was a turnaround in the first seven months through July this year when 82,000 manufacturing jobs were created (Figure 5).
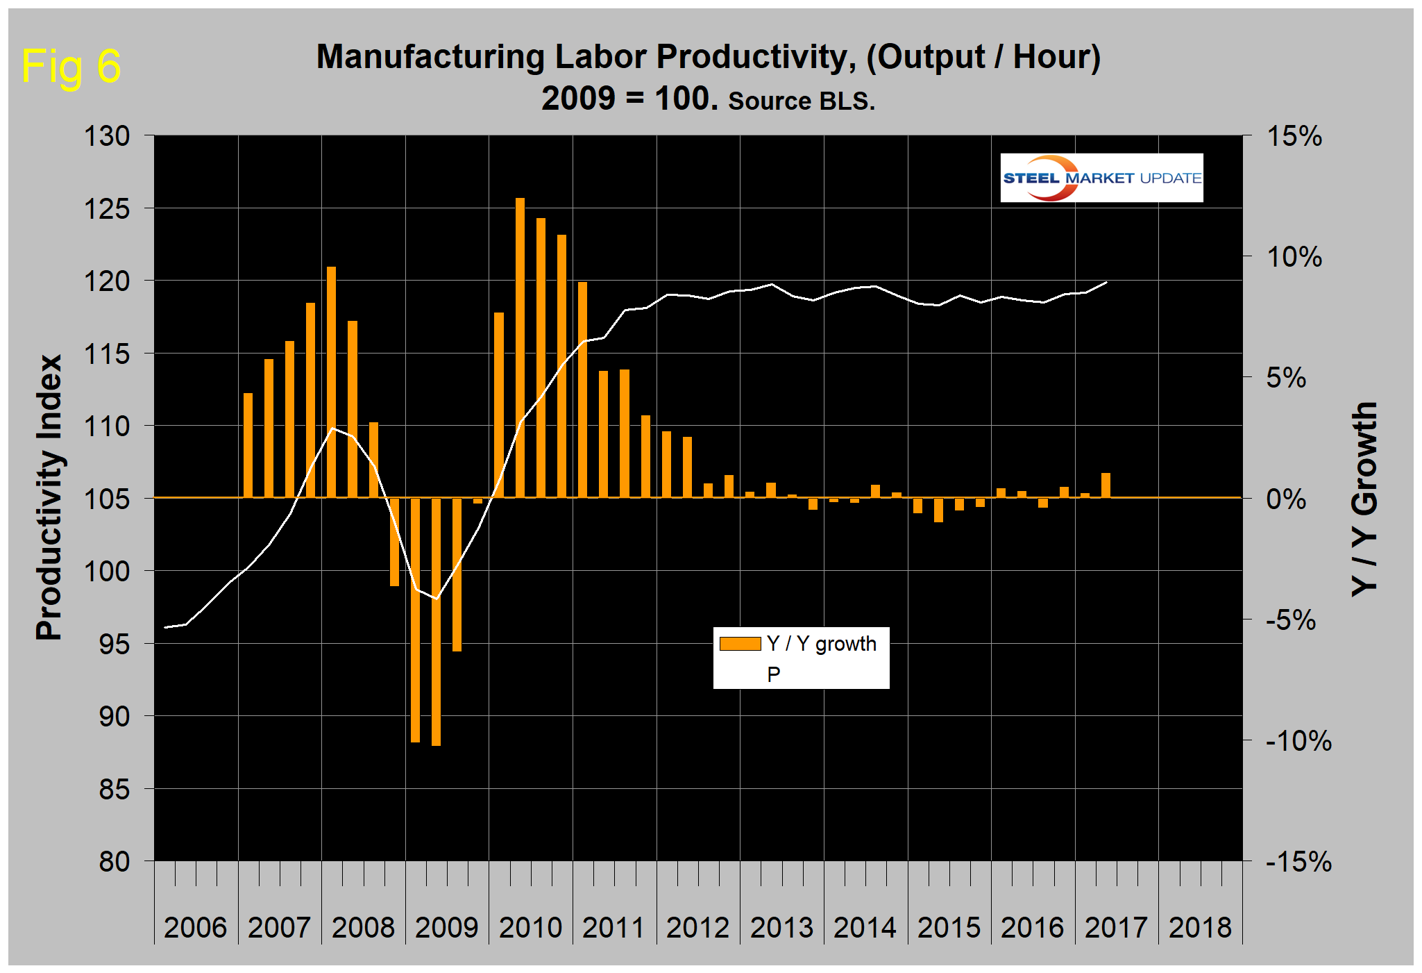
Manufacturing Productivity: The Bureau of Labor Statistics reports that in Q2 2017, manufacturing productivity improved by 1.0 percent year-over-year (Figure 6). This was the highest growth rate since Q4 2012. The bad news is that output per hour is still at the same level as it was in Q2 2013.
The Institute for Supply Management Manufacturing Index: ISM’s manufacturing index is a diffusion index. The institute states: “Diffusion indexes have the properties of leading indicators and are convenient summary measures showing the prevailing direction of change and the scope of change. An index value above 50 percent indicates that the manufacturing economy is generally expanding; below 50 percent indicates that it is generally declining.” Figure 7 shows the 3MMA of the ISM index from January 1997 through July 2017 with an improving trend since January 2016. The index has made no progress this year, but is still signaling future expansion with a 3MMA value of 56.3 in July. June at 57.8 was the best result since October 2014.
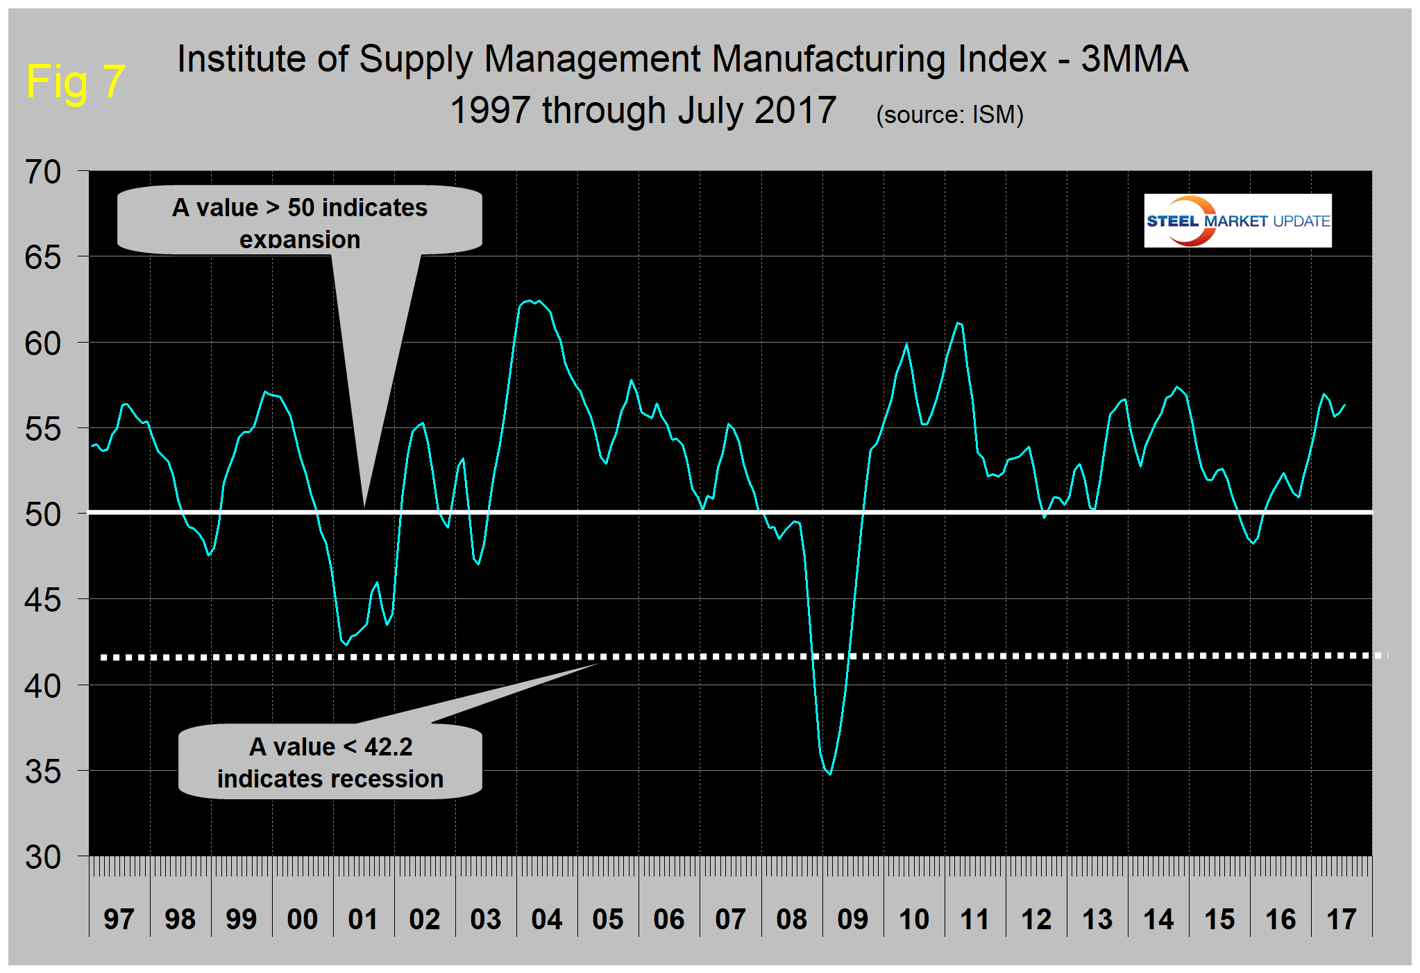
SMU Comment: The manufacturing indicators are still healthy overall and portend well for the balance of this year. The ISM index, which we give the most credence, is still signaling expansion. This is the only leading indicator examined in this update. Auto assemblies and supplier industries are slowing in NAFTA, and the U.S. and Canada are losing share to Mexico. Manufacturing employment has had positive growth in 2017, and the employment component of the ISM index has had positive growth in each of the last 10 months. The most disappointing indicator is manufacturing productivity, which despite an improvement in the second quarter has gone nowhere in the last four years.


