

Market Data

September 24, 2017
Chinese Steel Production Outpaces World
Written by Peter Wright
Growth in Chinese steel production continues to outpace the world, according to a Steel Market Update analysis of World Steel Association data.
Production in the month of August was 143,580,000 metric tons, down slightly from 143,729,000 metric tons in July. Capacity utilization was unchanged at 71.7 percent. The three-month moving averages (3MMA) that we prefer to use were 142,893,000 metric tons and 72.1 percent, respectively. Figure 1 shows monthly production and capacity utilization since January 2000.
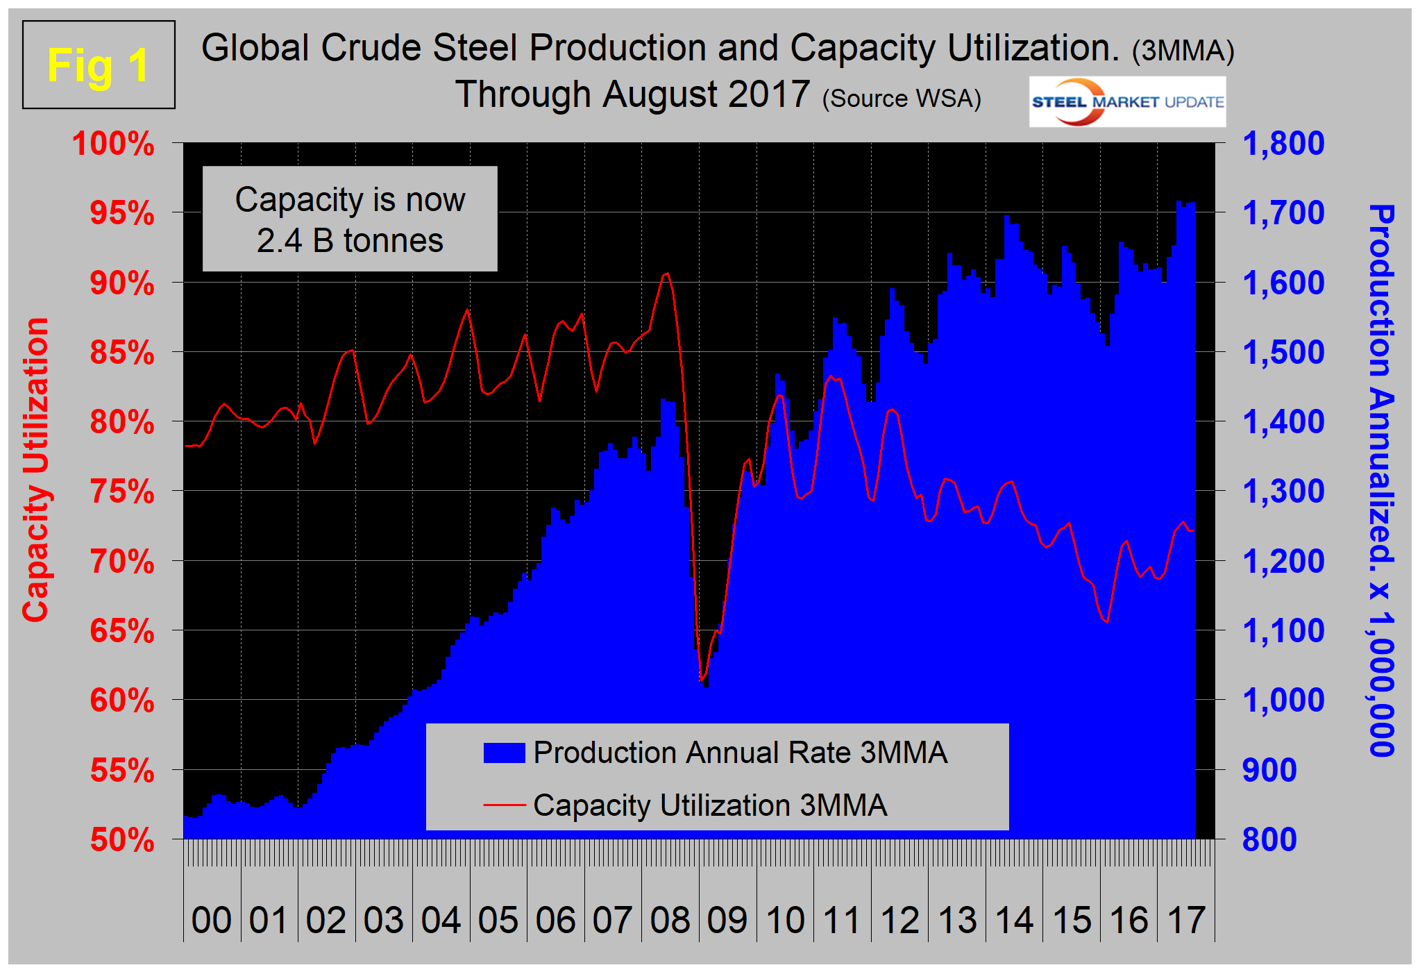
The summer slowdown that has occurred in each of the last seven years is not happening in 2017. On a tons/day basis, production in August was 4.632 million metric tons with a 3MMA of 4.660 million metric tons, down slightly from the all-time high in June of 4.690 million metric tons. In three months through August, production was up by 5.5 percent year over year.
On a 3MMA basis, capacity utilization had an erratically downward trajectory from mid-2011 through early 2016 when it bottomed out at 65.5 percent in February. In each of the last five months, the 3MMA of capacity utilization has been greater than 72 percent for the first time since June 2015. Last October, the OECD’s steel committee estimated that global capacity would increase by almost 58 million metric tons per year between 2016 and 2018 bringing the total to 2.43 billion tons. That forecast is coming to pass as capacity is now 2.4 billion tons.
As we dig deeper into what is going on, we start with seasonality. Global production has peaked in the early summer for the last seven years with April and June on average having the highest volume. Figure 2 shows the average tons/day production for each month since 2008.
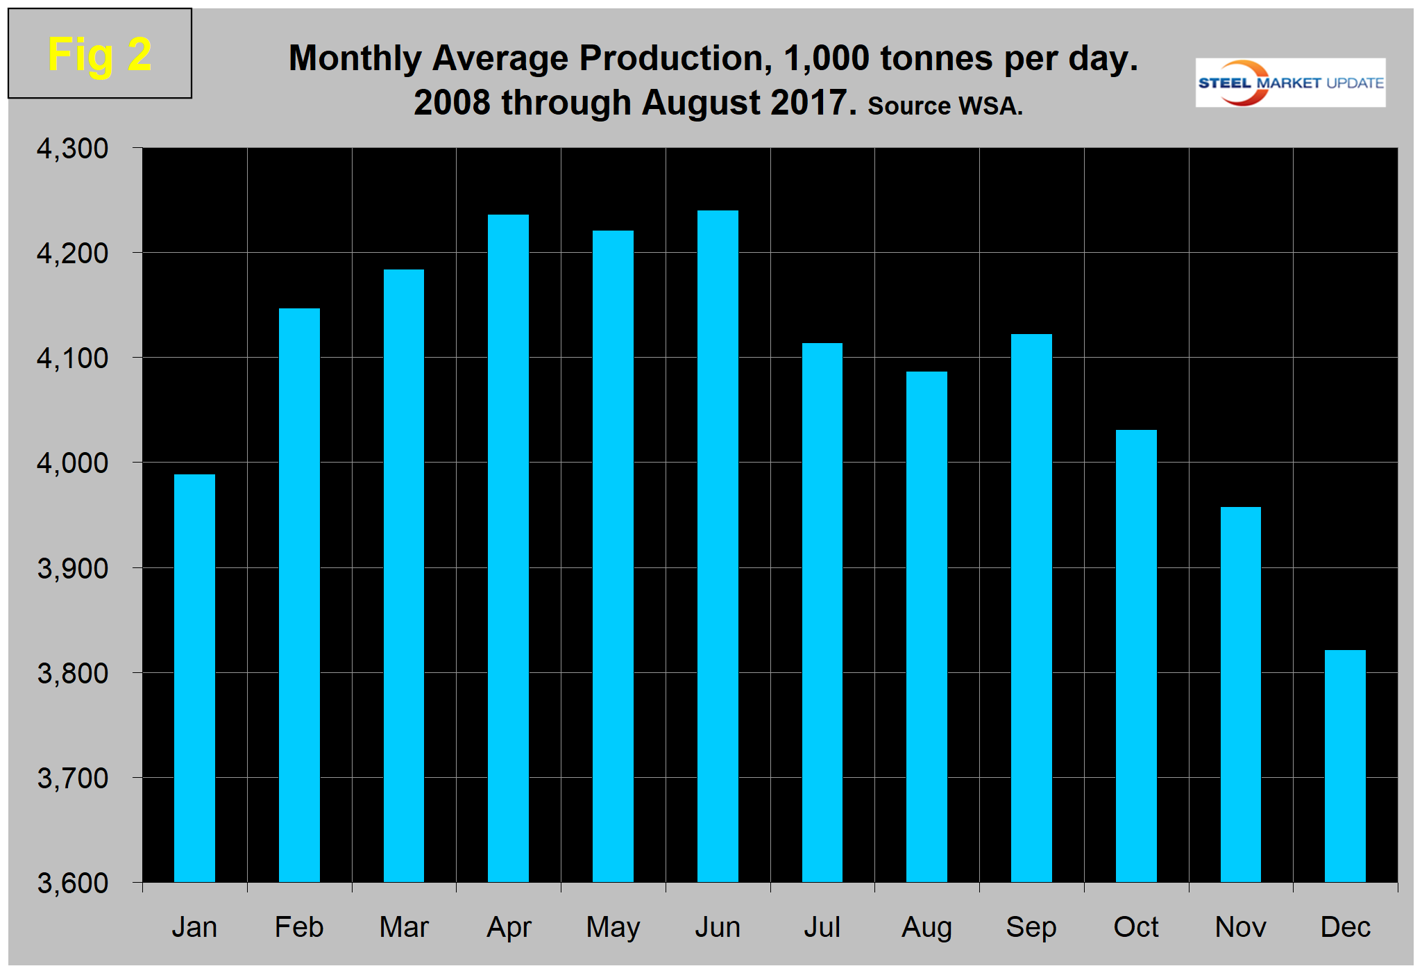
In those 10 years on average, August has been down by 0.65 percent; this year August was down by 0.1 percent. In each month June through August, the monthly change was better than the 10-year average. Figure 3 shows the monthly year-over-year growth rate on a 3MMA basis since January 2005.
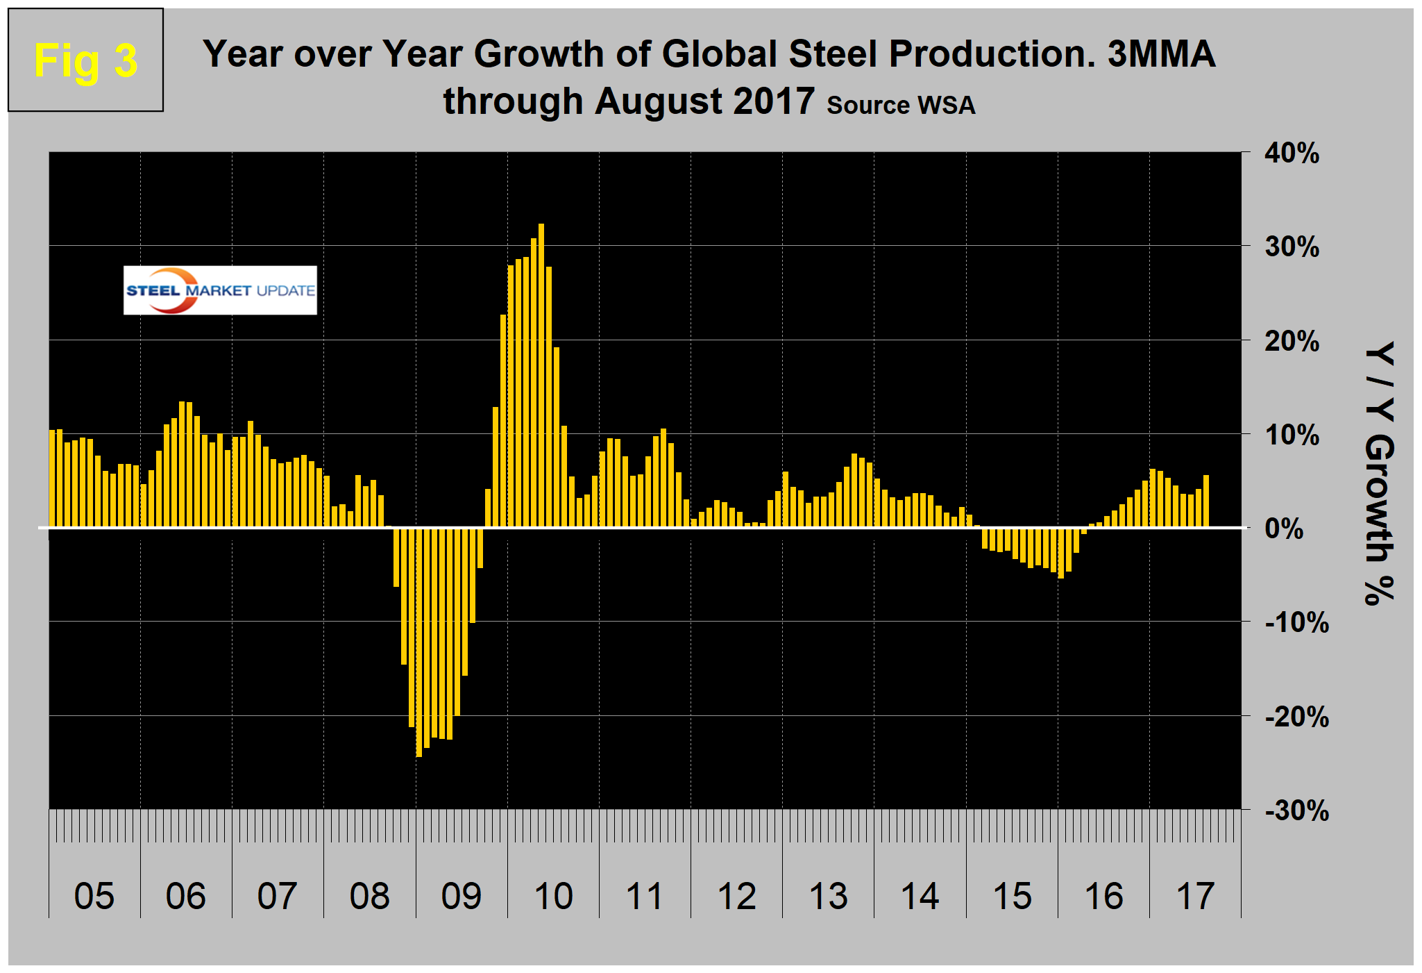
Production began to contract in March 2015, and the contraction accelerated through January 2016 when it reached negative 5.6 percent. Growth improved every month through January this year when it reached positive 6.2 percent. Since then, growth slowed to 3.5 percent in May and June and recovered to 4.0 percent and 5.5 percent in July and August.
In the 14 months through May, China’s growth rate was lower than the rest of the world. That changed in the three months through August when China began to pull away again. In August, China expanded by 8.4 percent, the world as a whole grew by 5.5 percent and the world excluding China expanded by only 2.6 percent. In August, China produced 52.0 percent of the global total, up from and 51.5 percent in July. These were the highest ever values for China’s global production share.
Table 1 shows global production broken down into regions, the production of the top 10 nations in the single month of August and their share of the global total. It also shows the latest three months’ and 12 months’ production through August with year-over-year growth rates for each period. Regions are shown in white font and individual nations in beige. The world as a whole had positive growth of 5.5 percent in three months and 4.8 percent in 12 months through August. If the three-month growth rate exceeds the 12-month rate, we interpret this to be a sign of positive momentum.
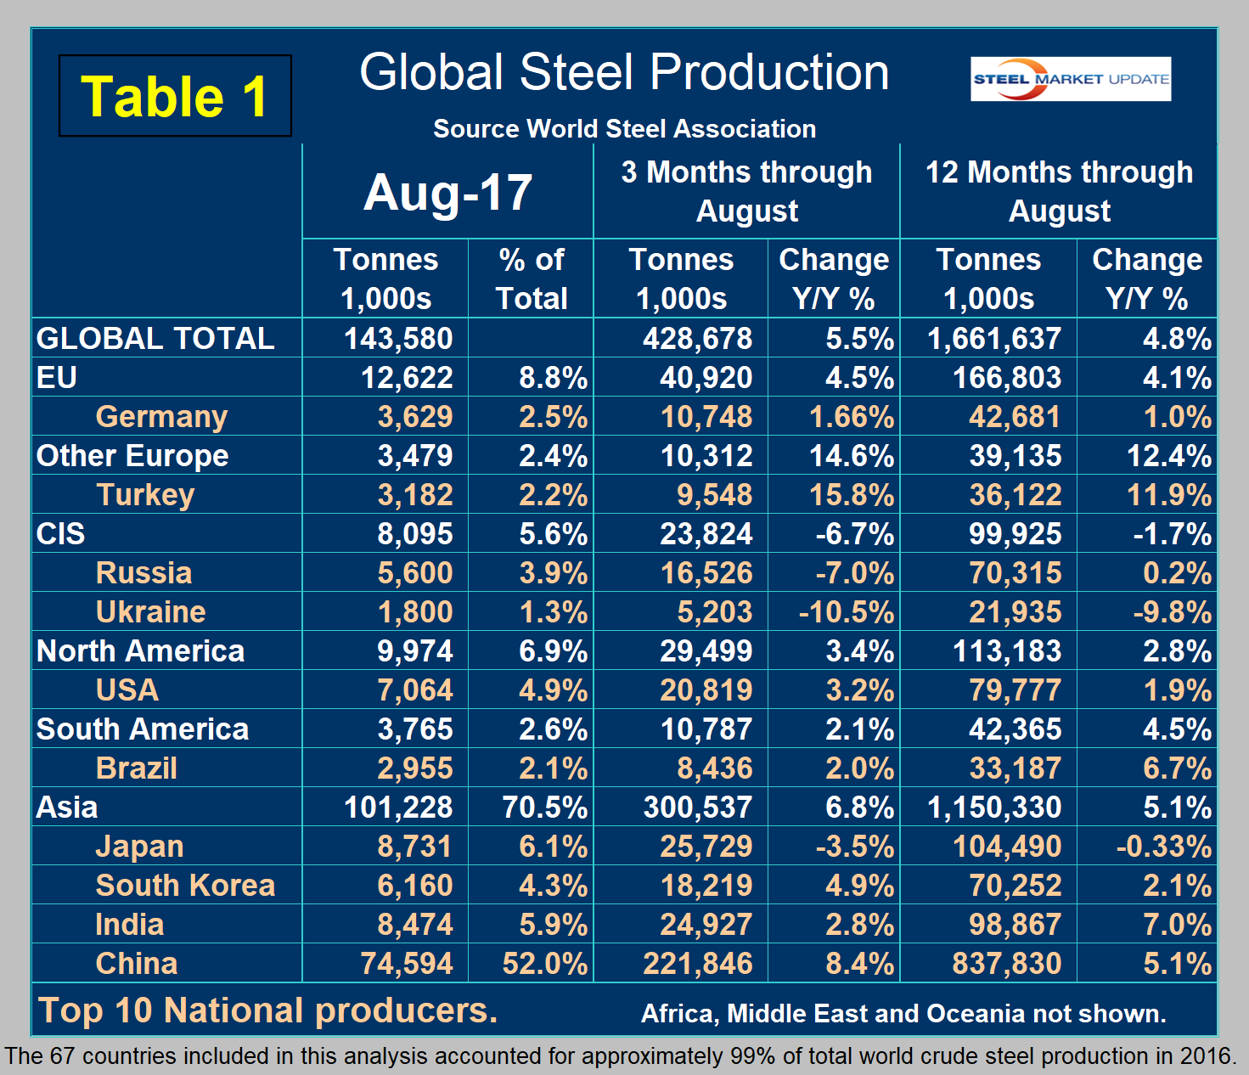
Table 1 shows that in both three and 12 months through August year over year, every region except the CIS had positive growth. North America was up by 3.4 percent in three months. Within North America, the U.S. was up by 3.2 percent, Canada was up by 5.7 percent and Mexico was up by 2.9 percent. In the first half of 2017, Mexico produced 54.8 percent more steel than Canada. Other Europe led by Turkey had the highest growth rate in three months through August year over year. Asia as a whole was up by 6.8 percent.
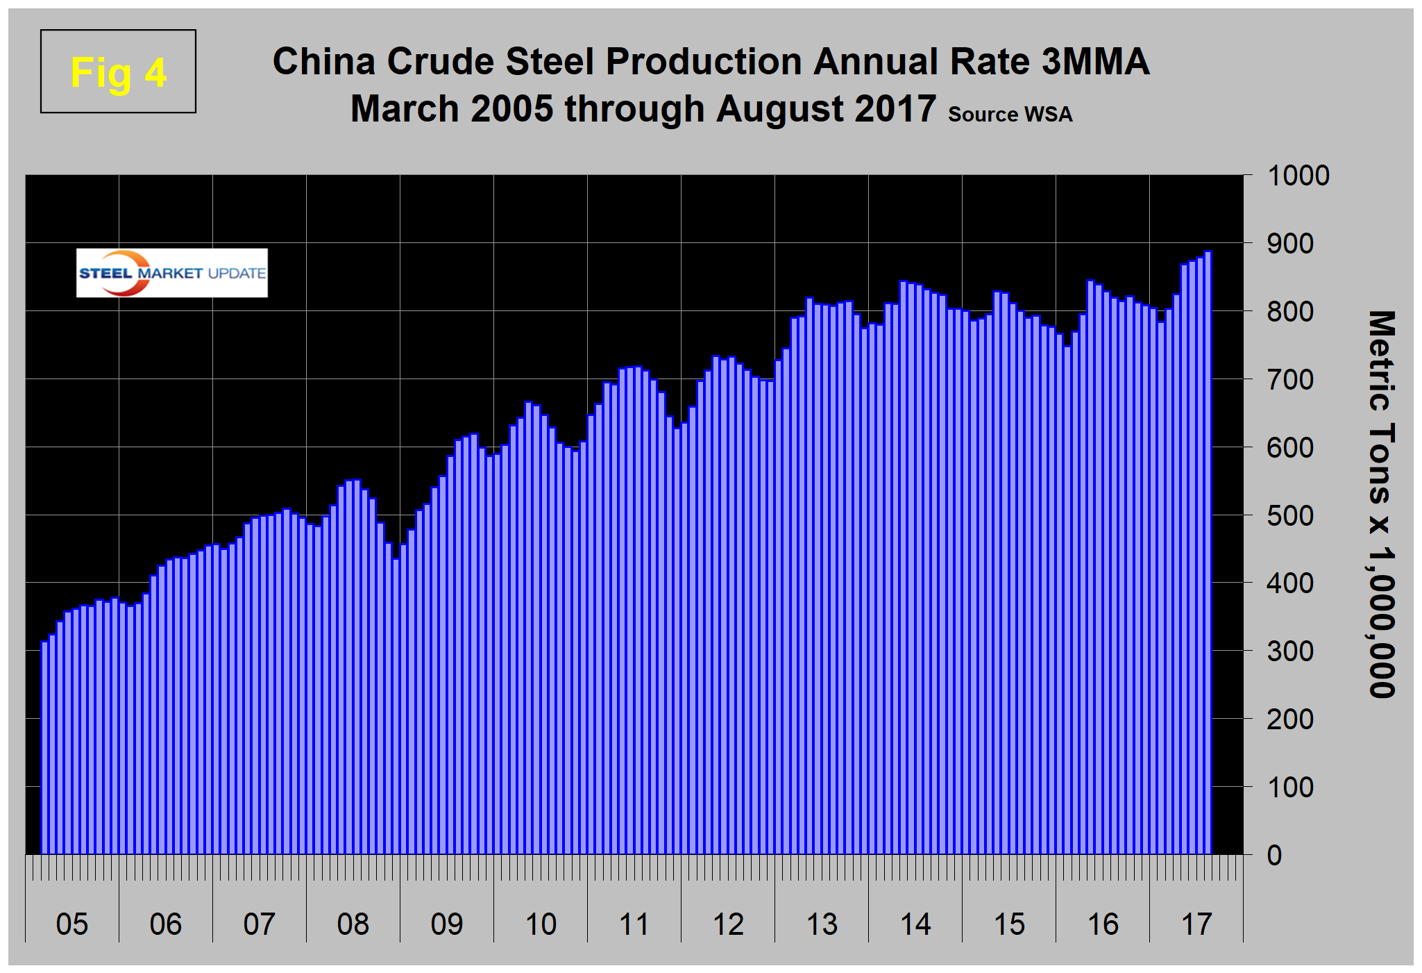
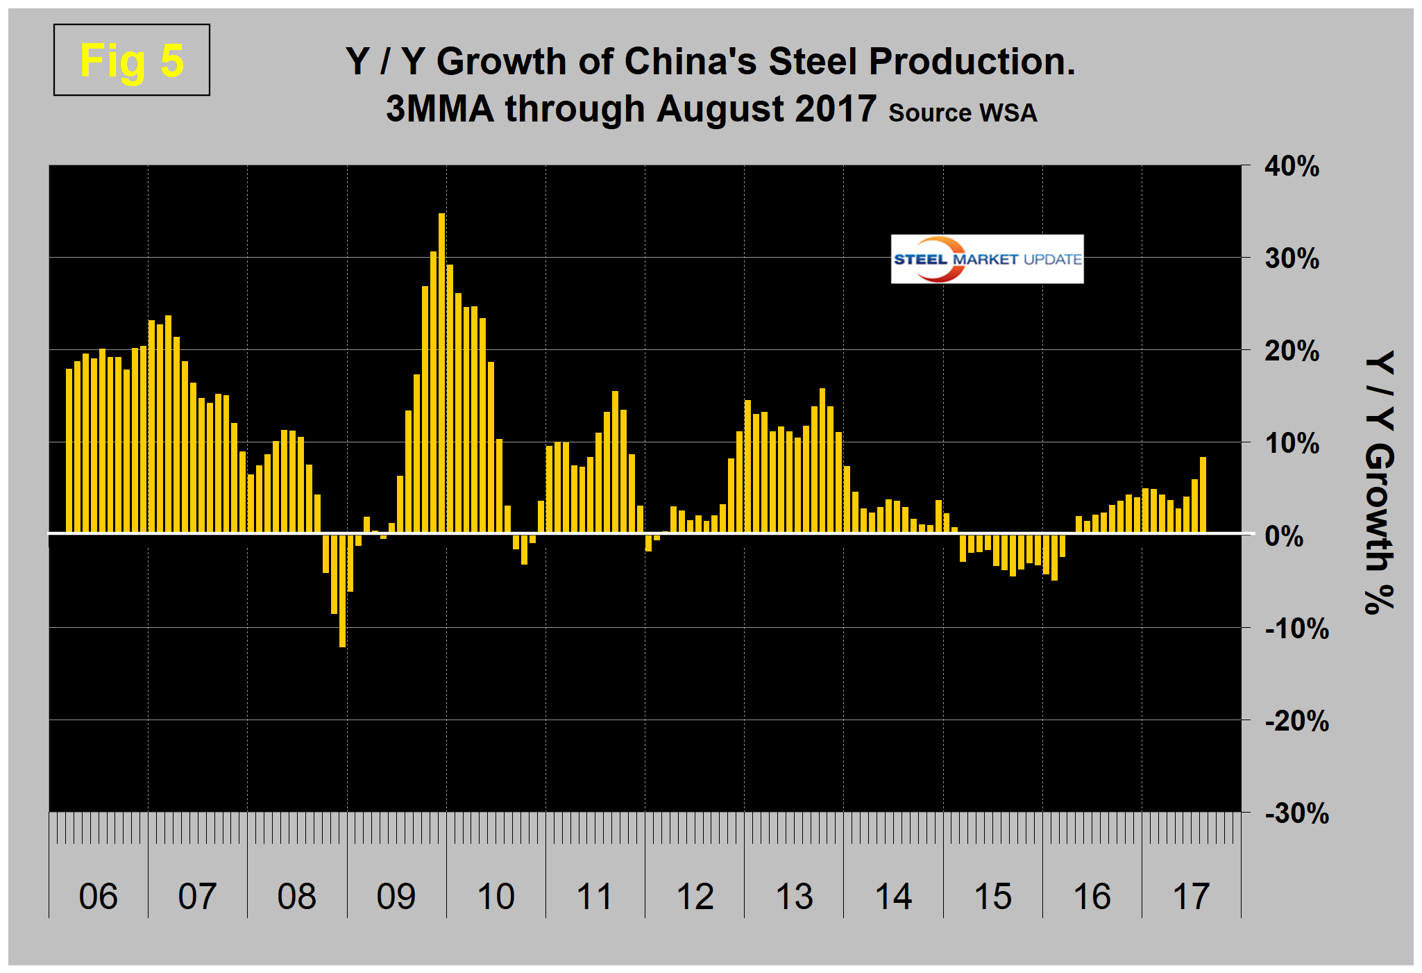
Figure 4 shows China’s production since 2005 and Figure 5 shows the year-over-year growth. China’s production after slowing for 13 straight months returned to positive growth each month from May 2016 through August this year on a 3MMA basis. The slowdown in Chinese steel production that they have been promising is not happening.
In previous monthly updates, we have included the April 2017 version of the World Steel Association Short Range Outlook for apparent steel consumption in 2017 and 2018. We will continue to include this as Figure 6 until the next update is released in October.
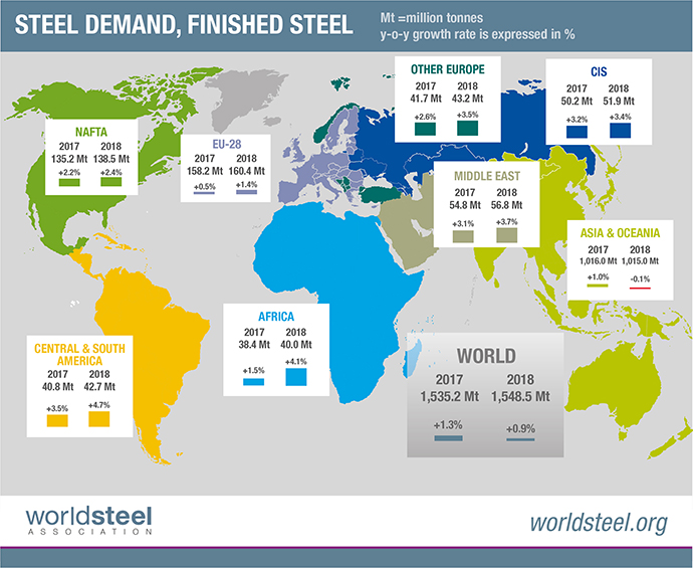
The April forecast was for global growth of 1.3 percent and 0.9 percent in 2017 and 2018, respectively. North American steel consumption is forecast to grow by 2.2 percent and 2.4 percent. Surprisingly, Asia is forecast to contract next year. Note this forecast is steel consumption, not crude steel production, which is the main thrust of what you are reading now.
Last month, the IMF took another look at its World Economic Outlook and made the following comments. The WEO will be formally updated in October. “The pickup in global growth anticipated in the April World Economic Outlook remains on track, with global output projected to grow by 3.5 percent in 2017 and 3.6 percent in 2018. The unchanged global growth projections mask somewhat different contributions at the country level. U.S. growth projections are lower than in April, primarily reflecting the assumption that fiscal policy will be less expansionary going forward than previously anticipated. Growth has been revised up for Japan and especially the Euro area, where positive surprises to activity in late 2016 and early 2017 point to solid momentum. China’s growth projections have also been revised up, reflecting a strong first quarter of 2017 and expectations of continued fiscal support. Inflation in advanced economies remains subdued and generally below targets; it has also been declining in several emerging economies, such as Brazil, India and Russia.”
SMU Comment: Momentum in global steel production growth was positive in August for the first time since April. China has had increasingly positive momentum for the last three months. In three months through August, the momentum of global and Chinese steel growth was 0.8 percent and 3.3 percent, respectively. This is good from the point of view of global steel demand, but bad from the point of view of Chinese pressure on global steel trade. Chinese exports are reported to be down this year, but based on this August production update from the WSA, we don’t see how that relief can last.


