

Market Data

May 24, 2018
SMU Currency Analysis: U.S. Dollar Surged Last Month
Written by Peter Wright
Last month, Steel Market Update reported that the dollar had been trading in a narrow range for eight weeks and on April 13 had the same value as on Feb. 14. In the four weeks leading up to May 18, the situation completely changed as the dollar strengthened by 4.1 percent. (See the end of this report for an explanation of data sources.)
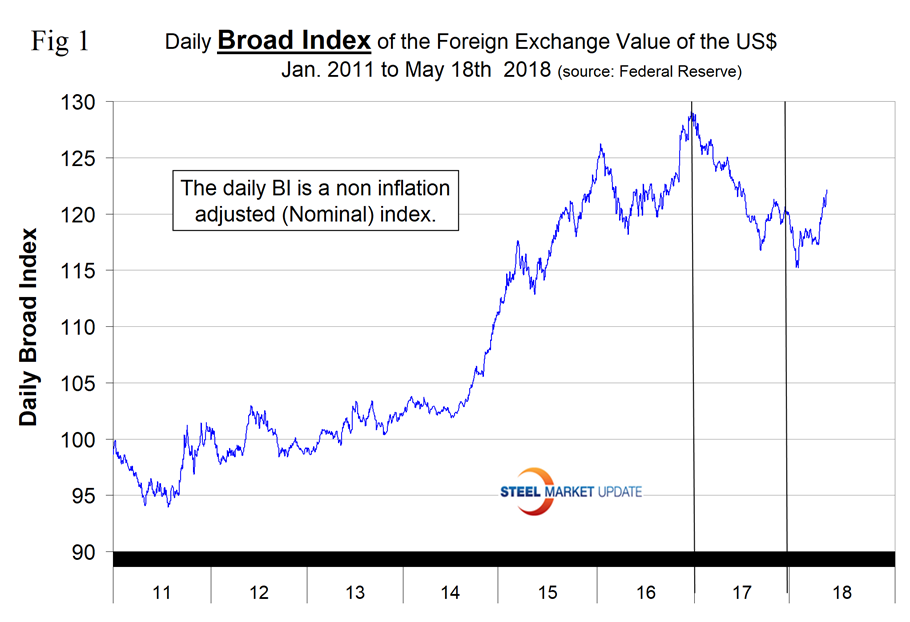
The daily broad index reported by the Federal Reserve on May 18 was the highest since July 5, 2017, and was up by 3.0 percent year to date. The analysis of currency trends is a highly technical undertaking. Therefore, in this monthly SMU update, we frequently incorporate the opinions of other experts. On May 3, analyst Andrew McElroy wrote: “The U.S. dollar has surprised many by rallying to make new yearly highs. There are multiple reasons behind the rally, with central bank policy divergence and the Fed’s comments on the yield curve particularly influential. When one central bank (the ECB) is trying to find explanations for weakness and the other (the Fed) is highlighting strength, policy divergence and currency movement is understandable.”
Currency analyst Mark Chandler wrote on May 22: “The U.S. dollar is experiencing a powerful surge. It is a function of rising U.S. rates and gradually growing confidence that the Federal Reserve may hike rates three more times this year rather than the two that the median Fed forecast anticipated. The dollar’s advance is also a reflection of poor developments abroad. Consider the recent news stream. The Japanese economy contracted in Q1 ’18, and the contraction was sufficiently large to offset in full the revised slower growth reported in Q4 ’17. That means the world’s third-largest economy is smaller now than at the end of last September. Germany, the economic engine of Europe and the world’s fourth-largest economy, revised down Q1 growth to 0.3 percent from 0.4 percent. After a calm response to the Italian political drama since the early March election, investors reacted dramatically in the second half of last week, selling Italian bonds and stocks. This weighed on other peripheral European bond markets. Much of the funds likely stayed in the Eurozone, but with what many see as the prospects for a Greece-like confrontation between Italy and the EU, the news also appeared to weigh on the euro.”
The Broad Index value of the U.S. dollar is reported several days in arrears by the Federal Reserve; the latest value published was for May 18. Figure 1 shows the index value since January 2011. The dollar had a recent peak of 128.96 on Jan. 3, 2017, which was the highest value in almost 15 years; the recent low point was the Feb. 1, 2018, at 115.21. Since then, the dollar has recovered to 122.16 on May 18.
Each month, SMU publishes an update of Table 1, which shows the value of the U.S. dollar against the currencies of 16 major global steel and iron ore trading nations. The table shows the change in value in one year, three months, one month and seven days through May 22.
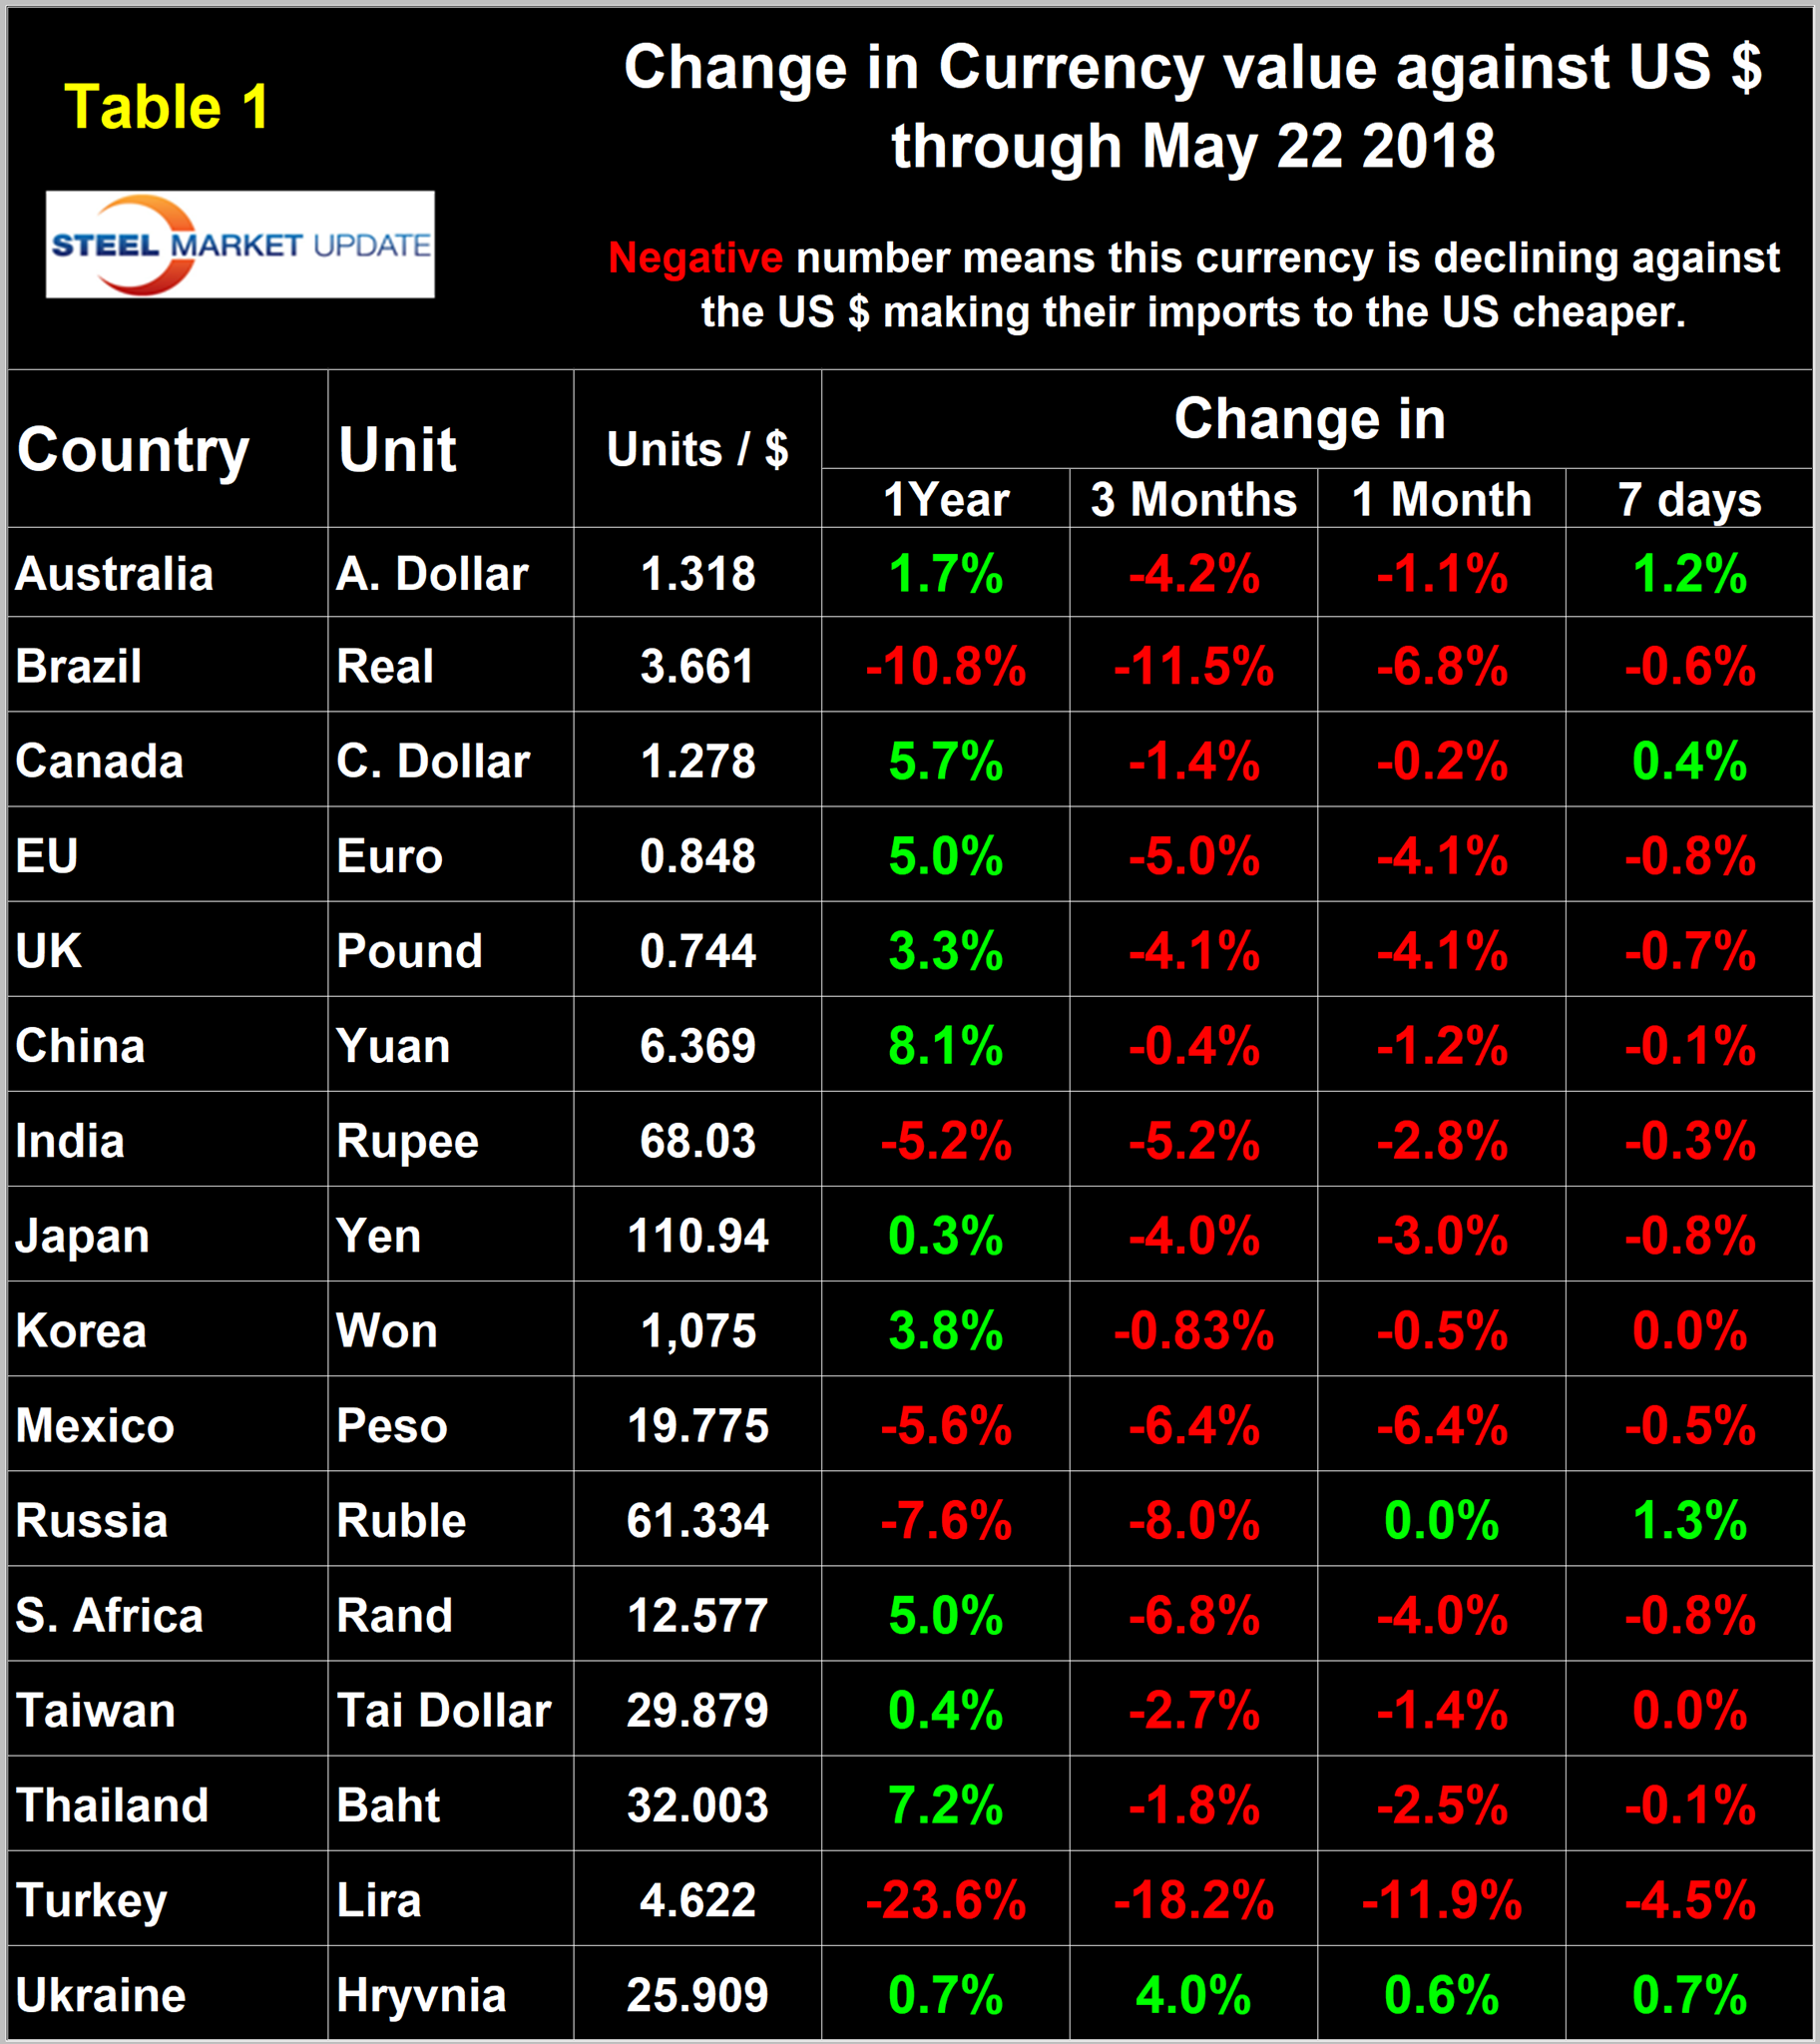
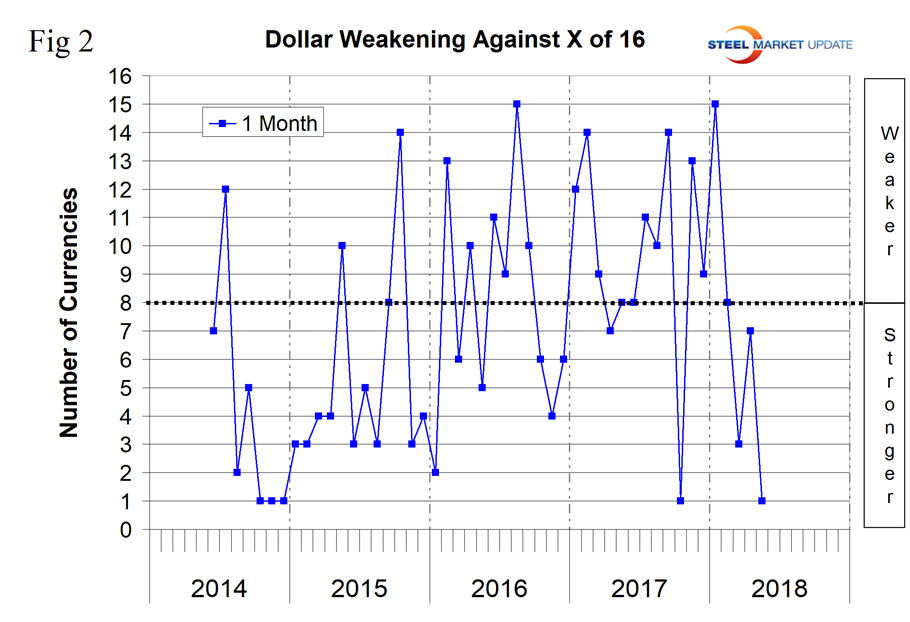
Figure 2 gives a longer-range perspective and shows the extreme gyrations that have occurred in the last three years. Compared to January this year, there has been a complete reversal. In the latest data, the dollar strengthened against 15 of the 16 currencies in both the three-month and one-month comparison with extreme declines of the Brazilian real and the Turkish lira. Quite often the change in value of these 16 currencies does not accord with the broad index, but this is not one of those times.
A rising dollar puts downward pressure on all commodity prices that are greenback denominated. Table 1 is color coded to indicate strengthening of the dollar in red and weakening in green. We regard strengthening of the U.S. dollar as negative and weakening as positive because of the effect on the trade balance of all commodities including steel and on the total national trade deficit. (See the appendix at the end of this piece.)
In each of these reports, we comment on several of the 16 steel and iron ore trading currencies listed in Table 1 and over a period of several months will describe the history of all of them. Charts for each of the 16 currencies are available through May 22 for any premium subscriber who requests them.
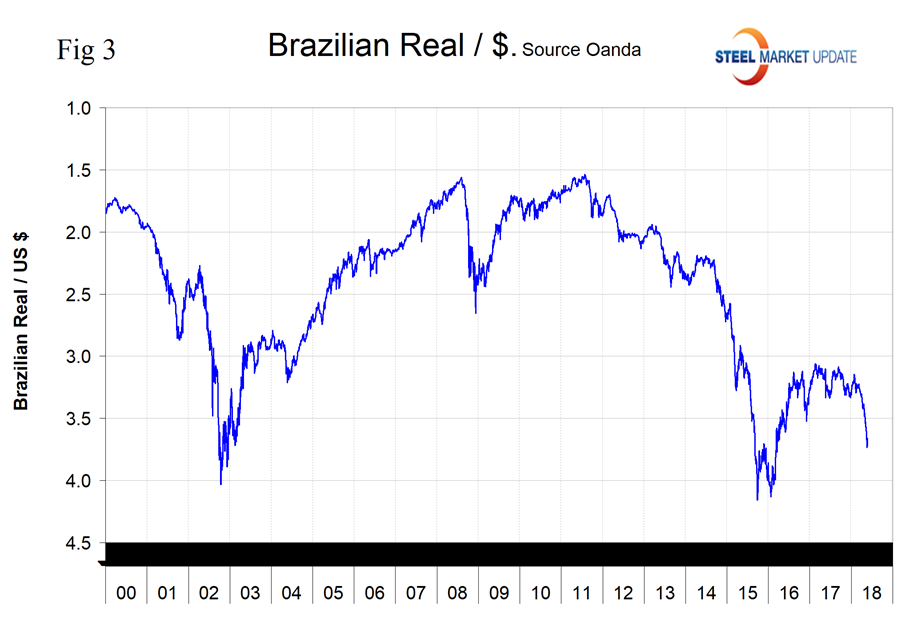
The Brazilian Real
Brazil’s real has significance as a global supplier of iron ore and semifinished into the U.S. The real has declined by 6.8 percent in the last month and by 11.5 percent in the last three months. The Central Bank of Brazil kept its key rate unchanged at 6.50 percent on May 16, a record low, following a 25-bps cut on March 21. The hold, unanimously voted, surprised the markets which were expecting another 25-bps decline and ended 11 straight cuts, keeping borrowing costs at the lowest in modern history. Interest rates in Brazil averaged 15.29 percent from 1999 until 2018, reaching an all-time high of 45 percent in March of 1999.
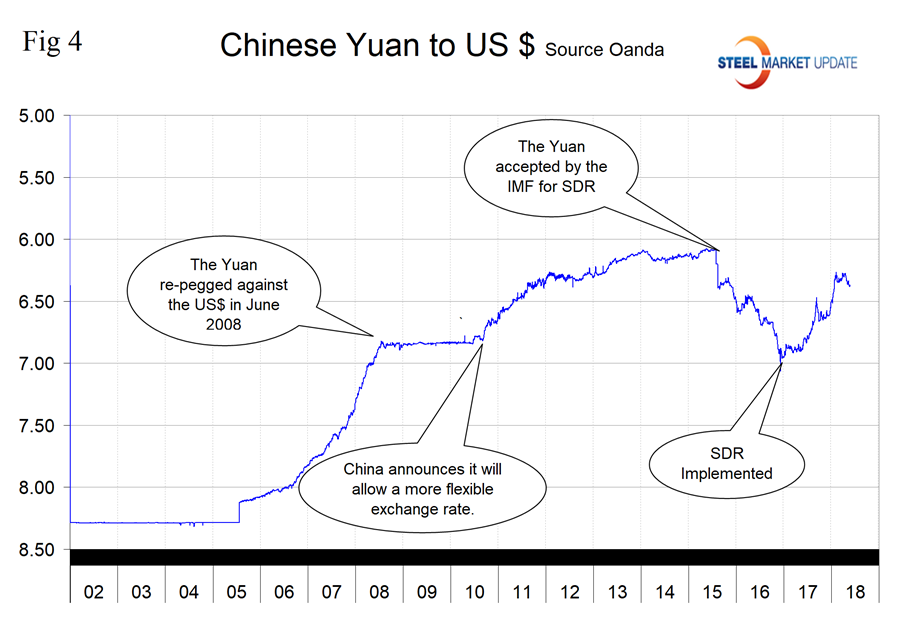
The Chinese Yuan
China’s yuan declined by 1.2 percent in the last month and is down by 0.4 percent in three months.
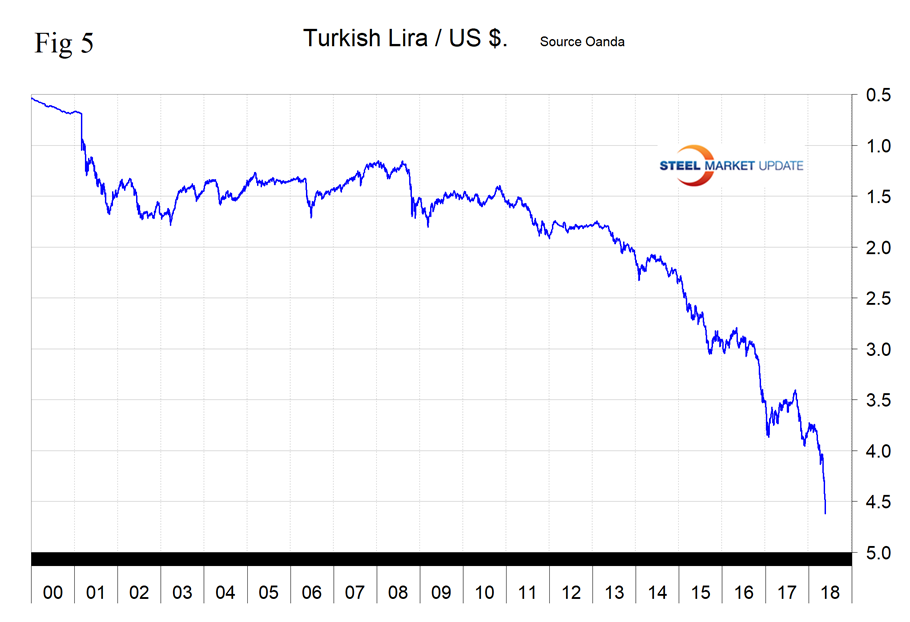
The Turkish Lira
Turkey’s lira has declined by 18.2 percent in three months, of which 11.9 percent occurred in the last month. Its value is now at a record low against the U.S. dollar. On Thursday, in a panic move, the Turkish government raised interest rates by 3.0 percent in an attempt to halt the slide.
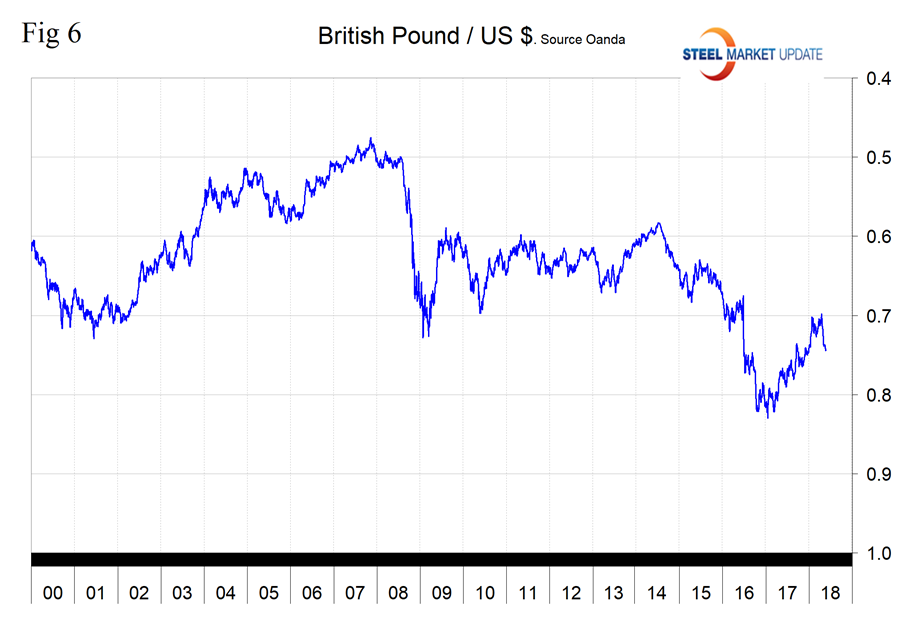
The UK Pound
The British pound has declined by 4.1 percent in the last three months, all of which occurred in the last month. It now takes $1.34 to purchase a British pound. “Sterling has been trading sideways in a $1.3455-1.3620 band since May Day. It finished last week threatening the lower end of the range,” reported Mark Chandler on May 22. “The consolidative pattern has a continuation feel to it, but the technical indicators are not offering much confirmation. A bounce may be limited now to the $1.3560 area, where the 200-day moving average is to be found. Speculators have trimmed the net long position, which appears poised to switch to a new short position in the next week or two.”
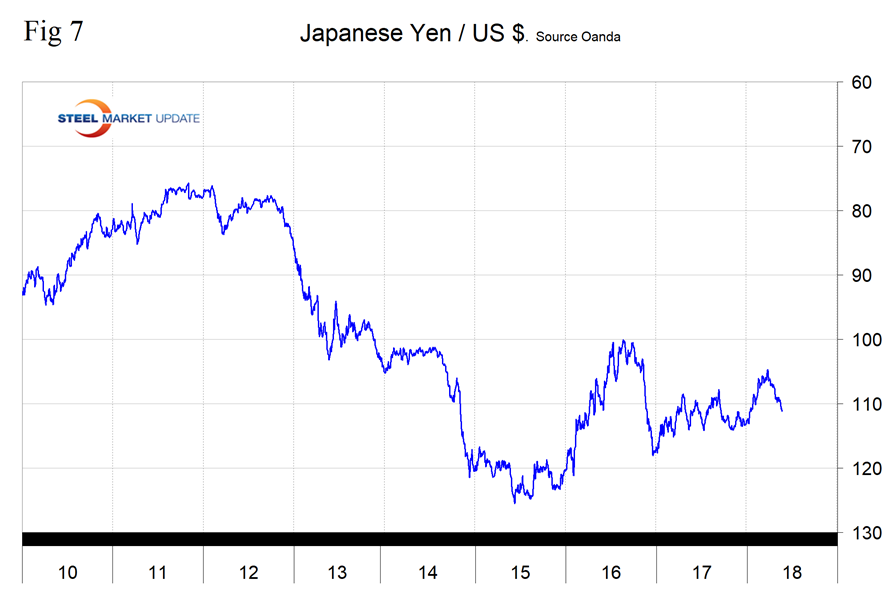
The Japanese Yen
Japan’s yen has weakened by 3.0 percent in one month and by 4.0 percent in three months to reach a value of 110.9 per U.S. dollar. “The dollar has been no slouch against the yen, rising every day last week,” Chandler noted. “The greenback’s advancing streak now stands at eight weeks. It is the longest run since Aug-Oct 2014. The dollar is trading at four-month highs as it probes the air above JPY111.00. Still, in the futures market, speculators added to the gross long yen position more than the gross short position, and thus shift the net position back to favor the longs after being net short for the past two reporting periods. The correlation between the exchange rate, Japanese equities, and U.S. yields has tightened.”
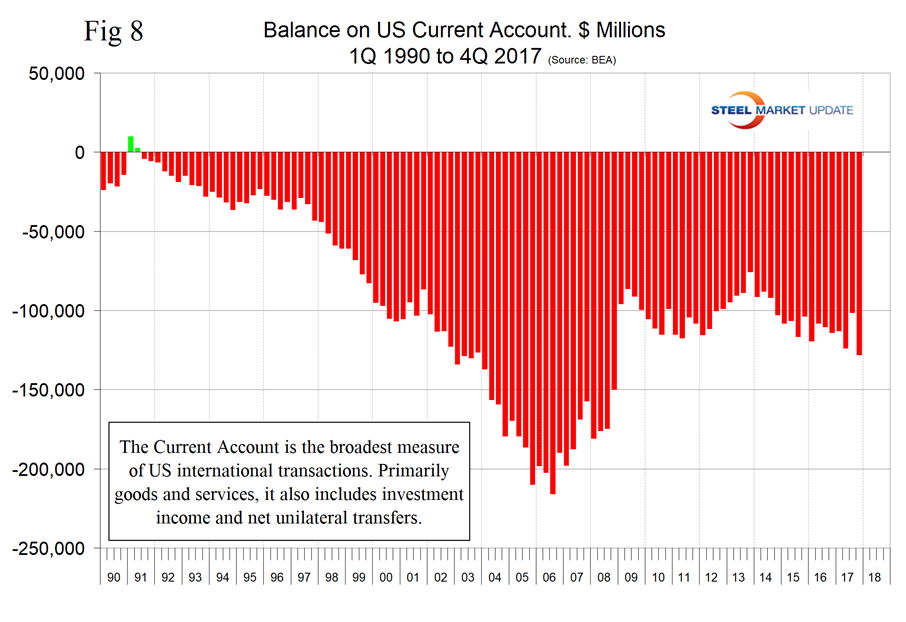
Appendix. This month, we updated our file of the U.S balance of payments and include it here as Figure 8, which is a chart of the situation since Q1 1990. The last time a surplus occurred was Q1 1991, and in the last 18 years the cumulative deficit has amounted to $10.3 trillion.
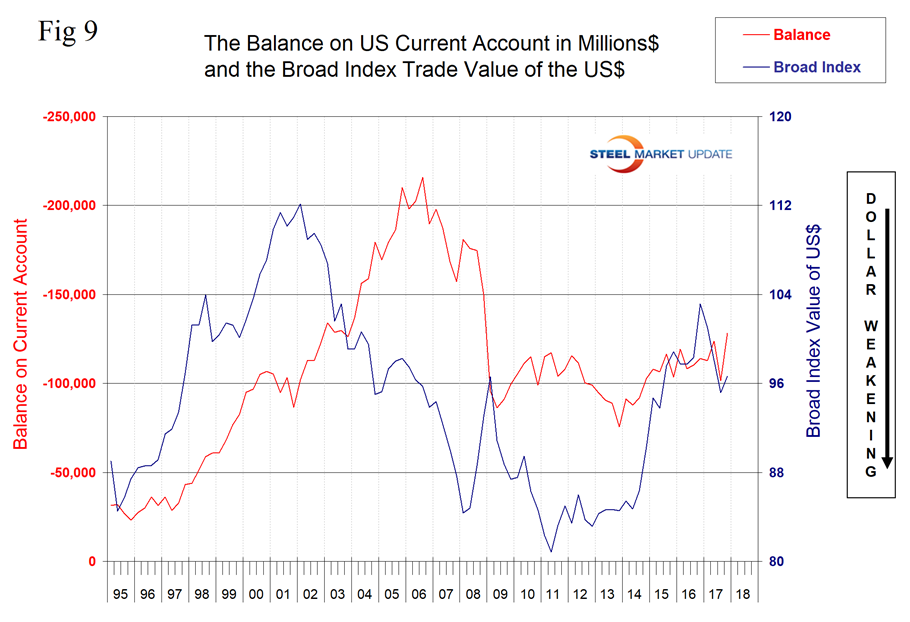
We then charted the current account deficit against the broad index value of the U.S. dollar, which is shown in Figure 9. The correlation wasn’t as strong as we expected, but there is more going on here than currency values. For example, in this period, the U.S. has moved from being a huge energy importer to a net energy exporter.
Explanation of Data Sources: The broad index is published by the Federal Reserve on both a daily and monthly basis. It is a weighted average of the foreign exchange values of the U.S. dollar against the currencies of a large group of major U.S. trading partners. The index weights, which change over time, are derived from U.S. export shares and from U.S. and foreign import shares. The data are noon buying rates in New York for cable transfers payable in the listed currencies. At SMU, we use the historical exchange rates published in the Oanda Forex trading platform to track the currency value of the U.S. dollar against that of 16 steel and iron ore trading nations. Oanda operates within the guidelines of six major regulatory authorities around the world and provides access to over 70 currency pairs. Approximately $4 trillion U.S. dollars are traded every day on foreign exchange markets.


