

Market Data

September 20, 2018
SMU Energy Analysis: Rig Count Levels Out
Written by Peter Wright
The following article is regularly published for our Premium users, but we decided to share it with our entire readership this month. If you are interested in upgrading to a Premium subscription, contact us at info@SteelMarketUpdate.com or 800-432-3475.
Oil and gas prices have stabilized, oil inventories are declining and the number of operating rigs exploring for oil and gas has seen little change in recent months.
The spot price of West Texas Intermediate (WTI) has been erratic in the last four months with two brief spikes above $70 per barrel. The price was $68.86 on Sept. 17, up from $66.50 in our last update on Aug. 20. The total number of operating rigs exploring for oil and gas has been essentially unchanged since June 1. The prices of oil and natural gas drive the consumption of energy-related steel products including oil country tubular goods, pipe fittings and well head equipment, among others. Welded tubular goods (not including OCTG) consumed about 5.5 million tons of hot rolled sheet in 2017.
Figure 1 shows historical oil and gas prices from January 2000 through Sept. 17, 2018. Our price and inventory data come from the Energy Information Administration (EIA). WTI was priced at $68.86 per barrel on the 17th; Brent crude was $78.22, realizing a differential of $9.36. This was the highest premium for Brent/WTI since February 2015. EIA expects Brent spot prices to average $72 per barrel in 2018 and $71 per barrel in 2019 with WTI averaging about $6 lower than Brent prices in 2018 and 2019. The price of natural gas at the Henry Hub in Louisiana, except for a few short-lived spikes, has made no progress in two years. Gas closed at $2.92 on Sept. 14. EIA expects Henry Hub natural gas spot prices to average $2.96 per million British thermal units (MMBtu) in 2018 and $3.10 per MMBtu in 2019. On Sept. 11, Pescadero Energy Partners wrote: “Natural gas is much cleaner burning than coal. The advent of horizontal drilling and fracking has unlocked a cheap and plentiful supply of natural gas, which has allowed it to easily overtake coal as the primary input for electricity generation. Coal supply has not magically disappeared. When the price of NG rises too high, utilities switch the production mix to a higher coal component to prevent costs from being passed on to the consumer. Thus, less NG is withdrawn from storage. In lieu of a major gas production/storage event, “coal switching” effectively caps the price for natural gas. The “coal switching” effect has certainly contributed to keeping the commodity range-bound for the past few years.”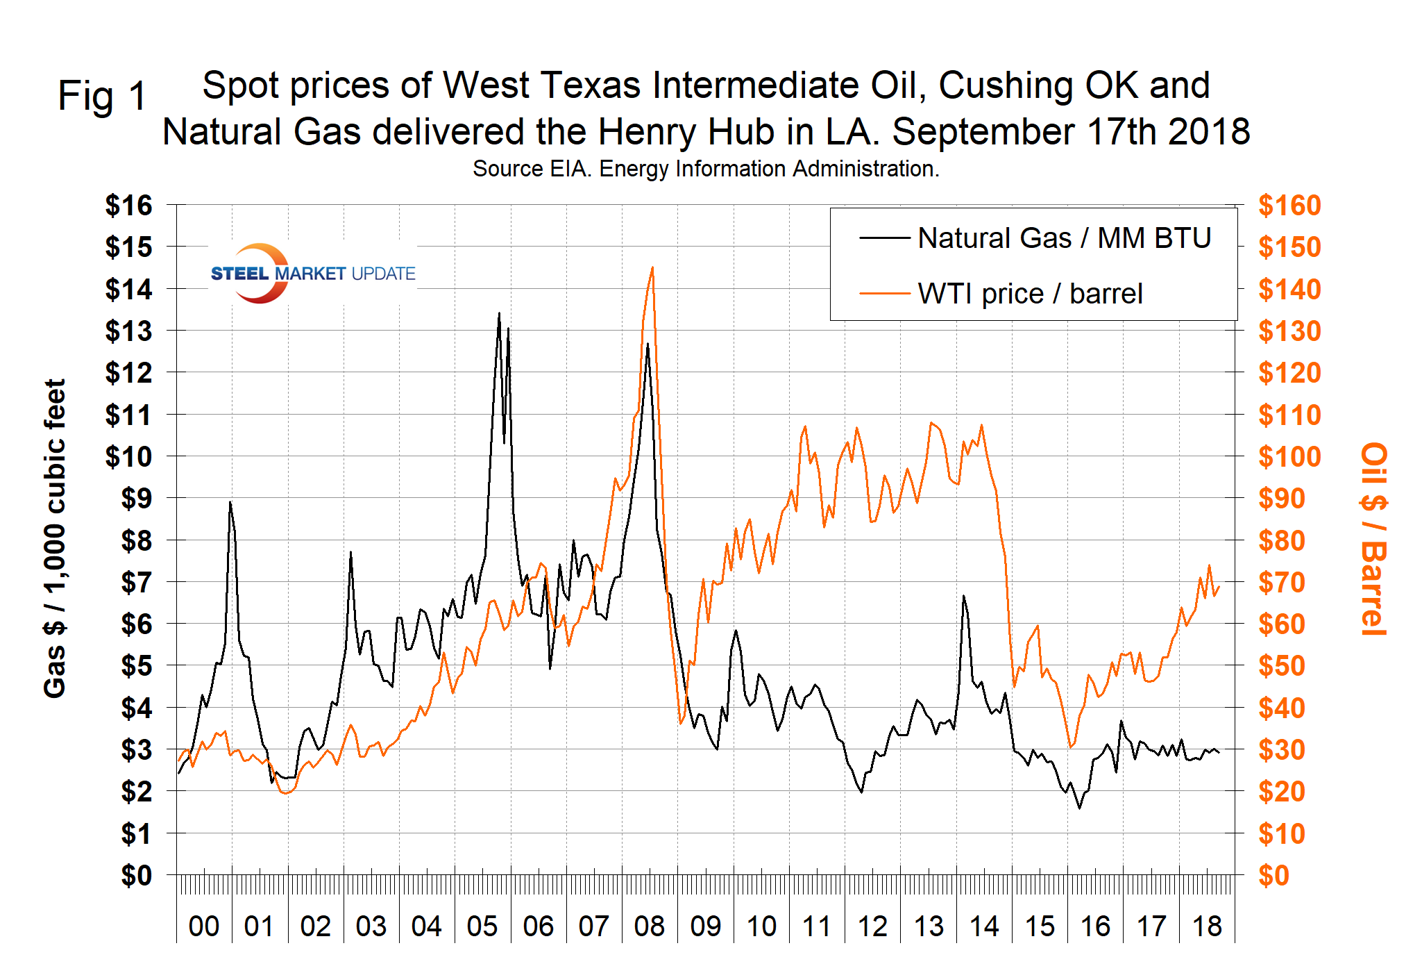
Stocks of crude oil in the U.S. are continuing to decline and are now lower than at any time since Jan. 23, 2015. Figure 2 shows the inventory level, including the strategic petroleum reserve and the year-over-year change.
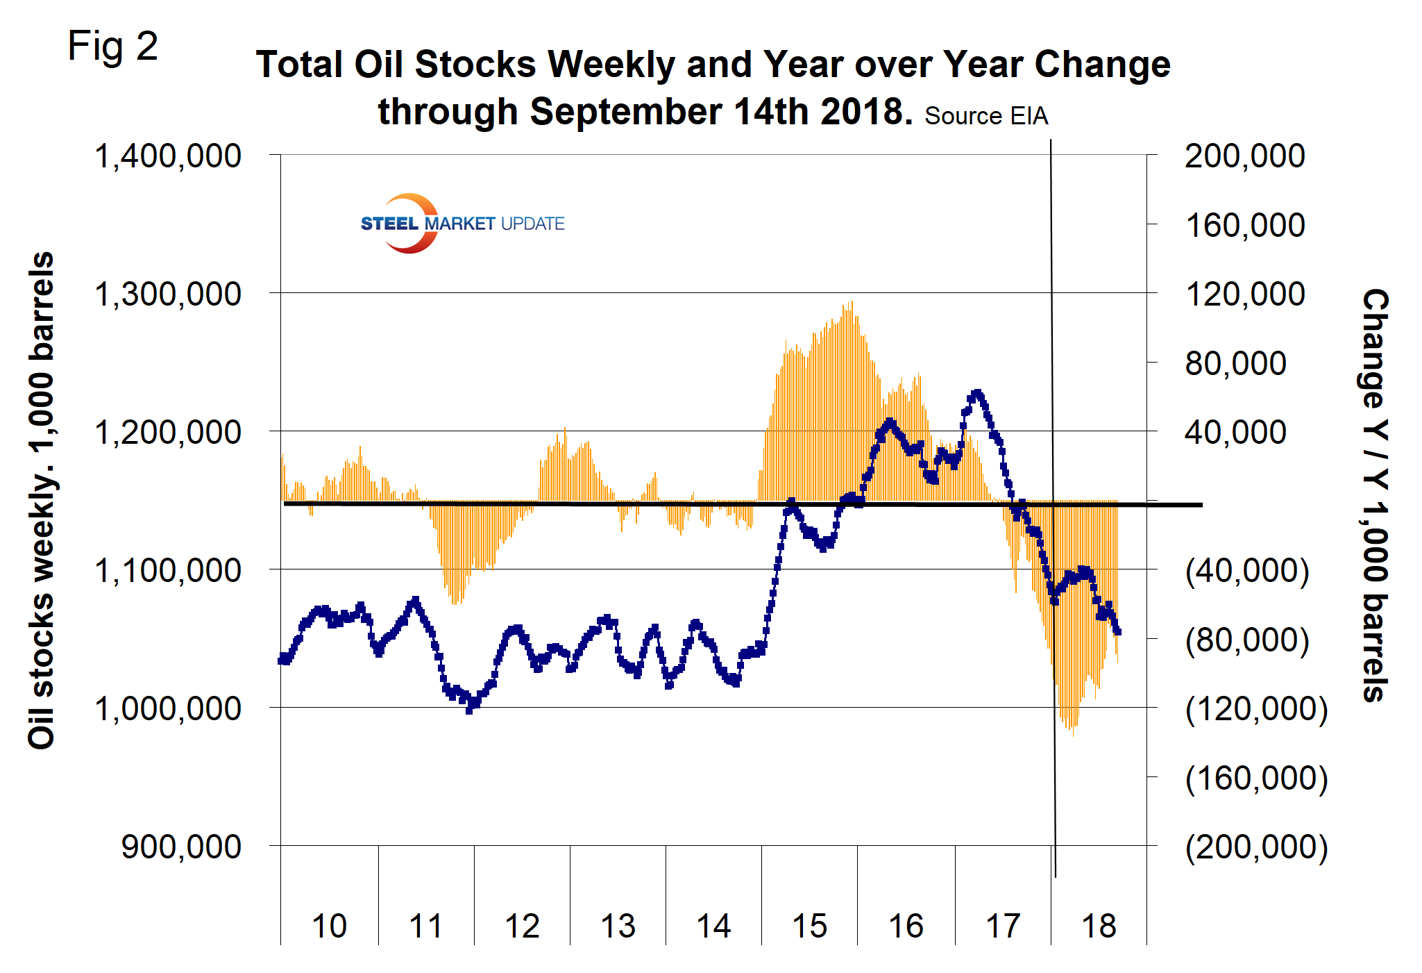
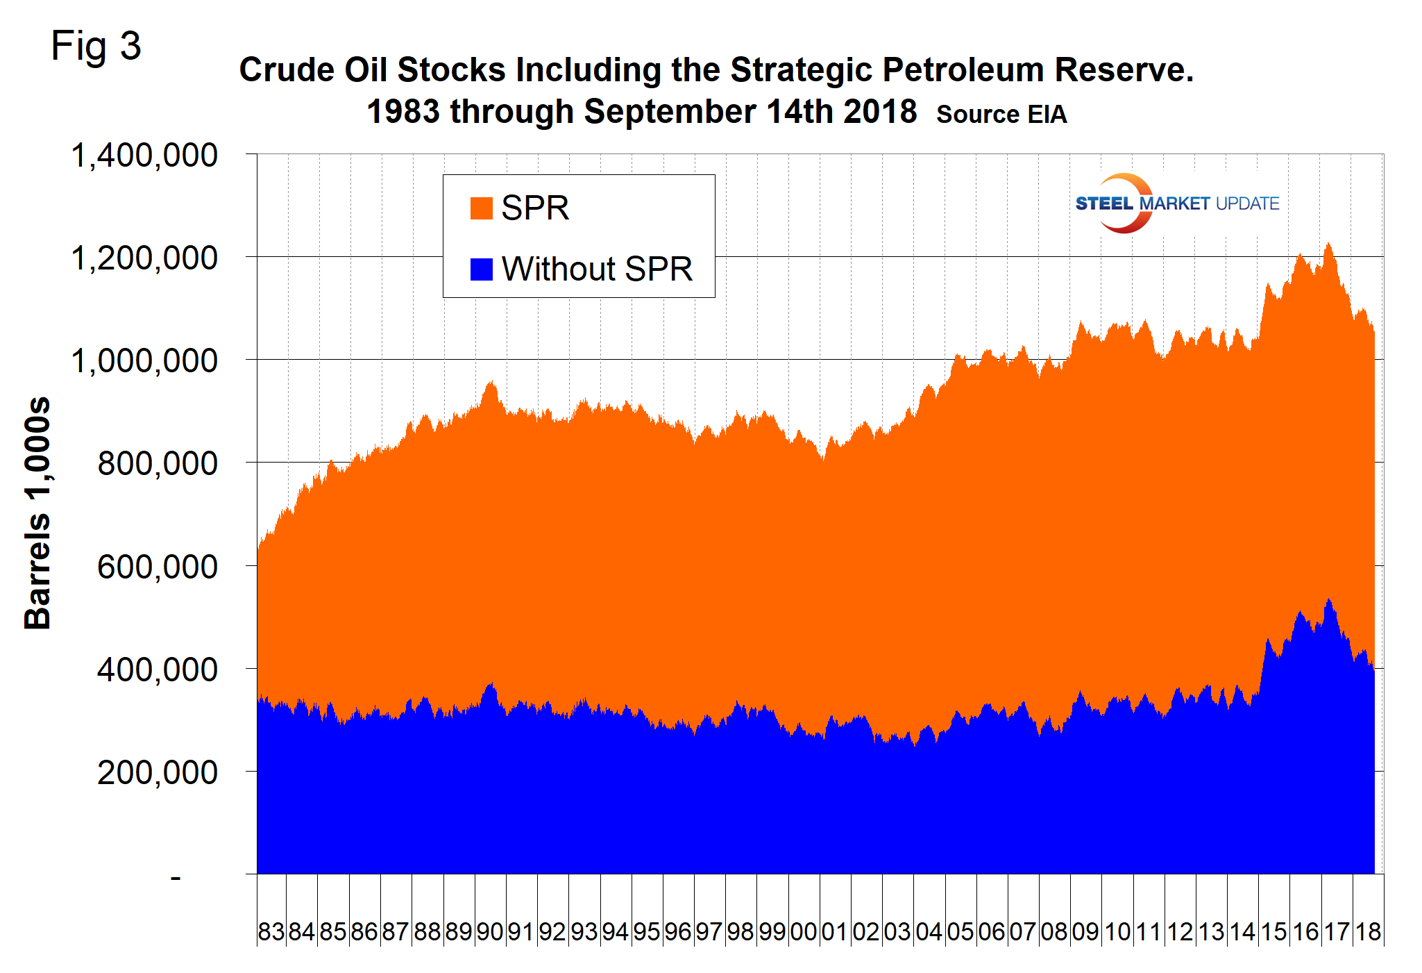
Figure 3 breaks total crude inventory into the working portion and the strategic petroleum reserve. Total inventories are down by 94 million barrels year over year.
The total number of operating rigs in the U.S. on Sept. 15 was 1,055, up from 924 at the beginning of this year. Figure 4 shows the total number of operating rigs in the U.S. and the weekly change. The count curve has been basically flat since June 1.
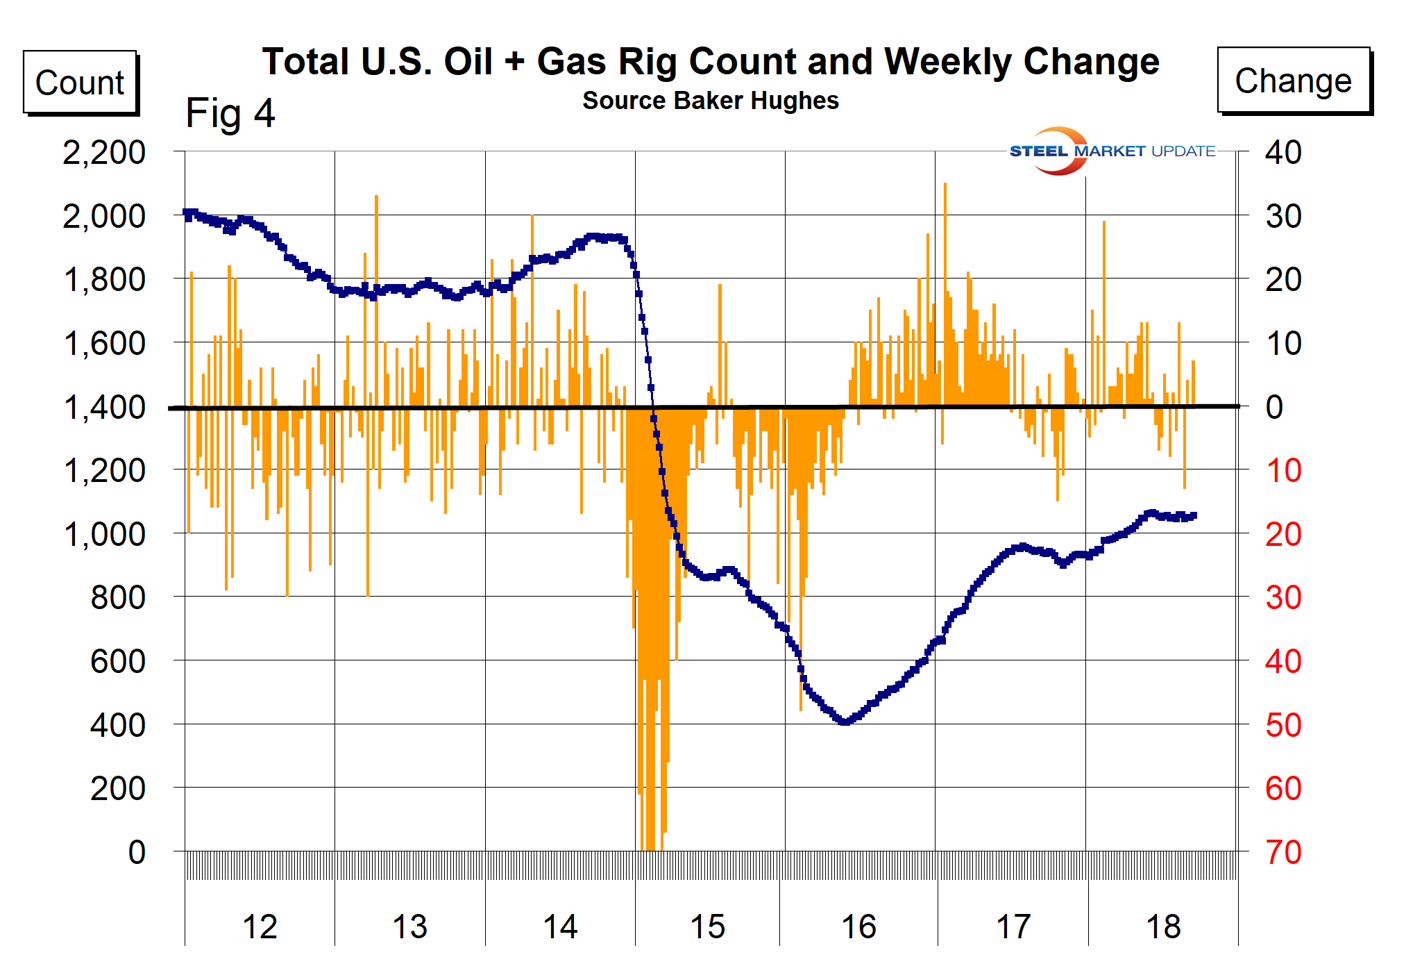
The oil rig count had a low point of 316 on June 27, 2016, and stood at 867 on Sept. 14, 2018. The count has increased by only eight since May 25. The U.S. gas rig count rose from its low point of 81 on Aug. 5, 2016, to 186 on Sept. 14. There has been zero increase in the gas rig count since June 16 last year. The year-over-year growth rate of total U.S. operating rigs was 12.7 percent in the latest data with oil up by 15.8 percent and gas up by zero percent. Figure 5 shows the Baker Hughes U.S. Rotary Rig Counts for oil and gas equipment in the U.S. (explanation below).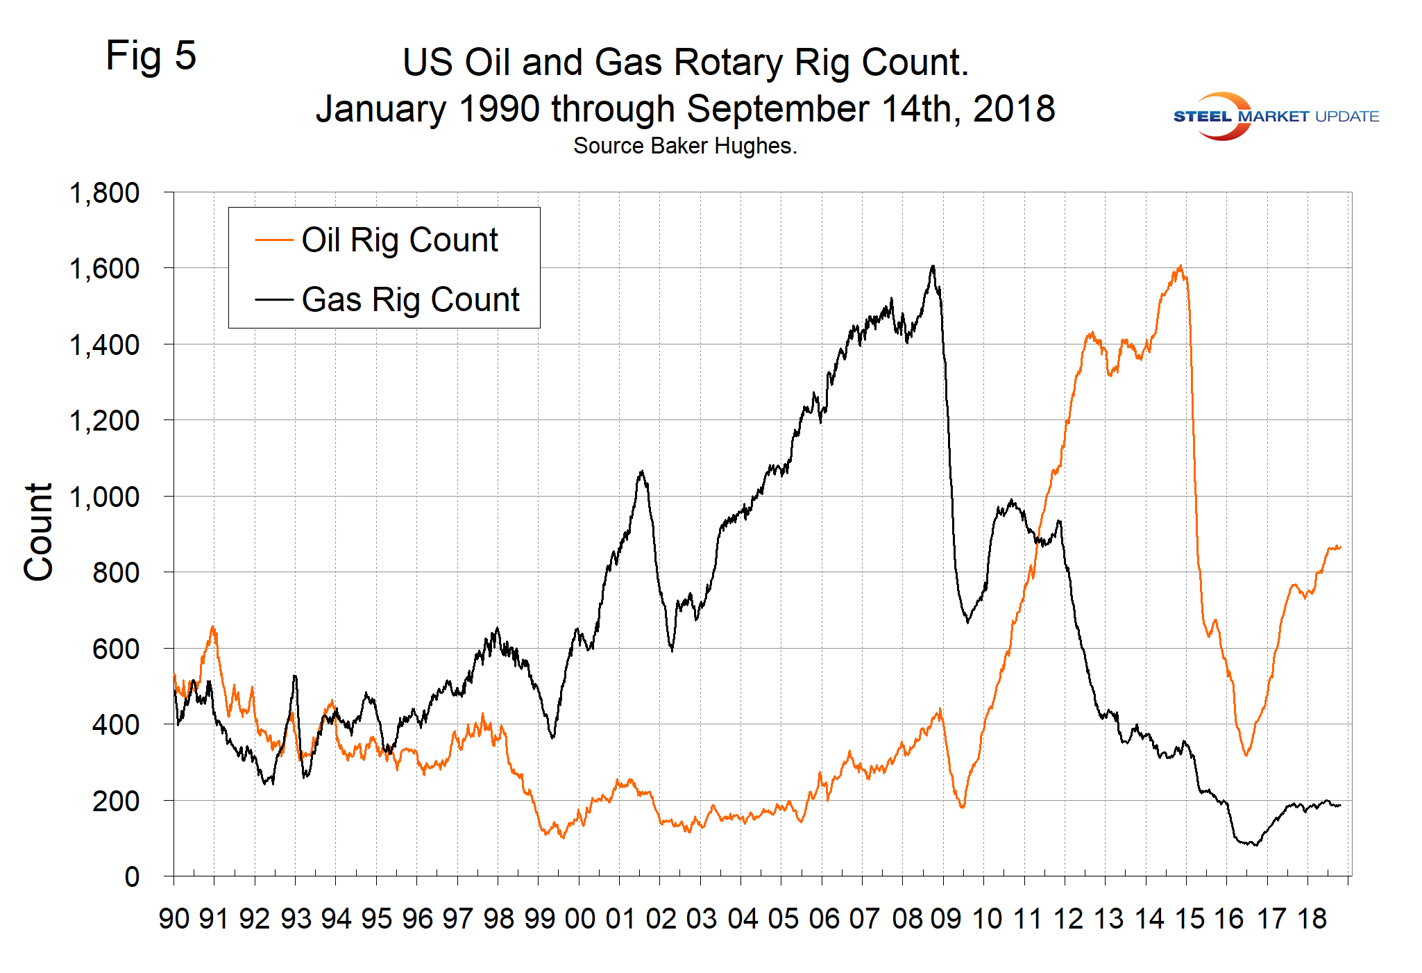
On a regional basis in the U.S., the big three states for operating rigs are Texas, Oklahoma and North Dakota. Figure 6 shows the land rig count in those states since 2000.
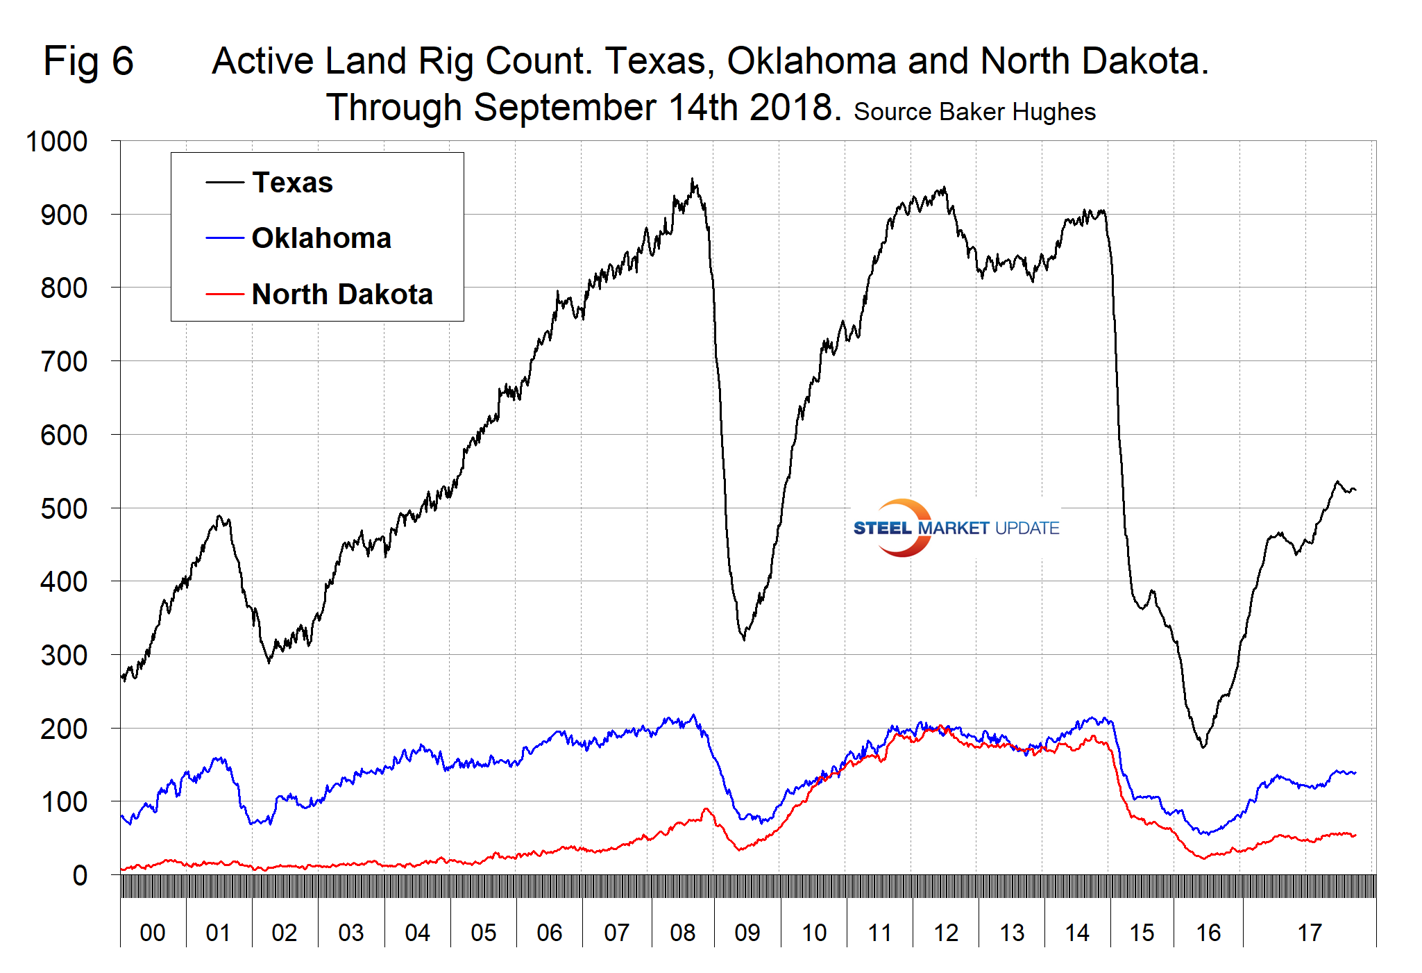
Figure 7 illustrates the monthly U.S. oilfield production of crude from January 1970 through June 2018 (latest data available) in thousands of barrels per month. The historical high was October 1970 at 310.4 million barrels. Production steadily declined to half that level in the late 2000s before the fracking revolution kicked in. December 2017 broke the old record with 310.7 million barrels produced and March set a new record at 324.7 million barrels. June production was 320.2 million. EIA forecasts that U.S. crude oil production will average 10.7 million barrels per day in 2018, up from 9.4 million in 2017, and will average 11.7 million in 2019.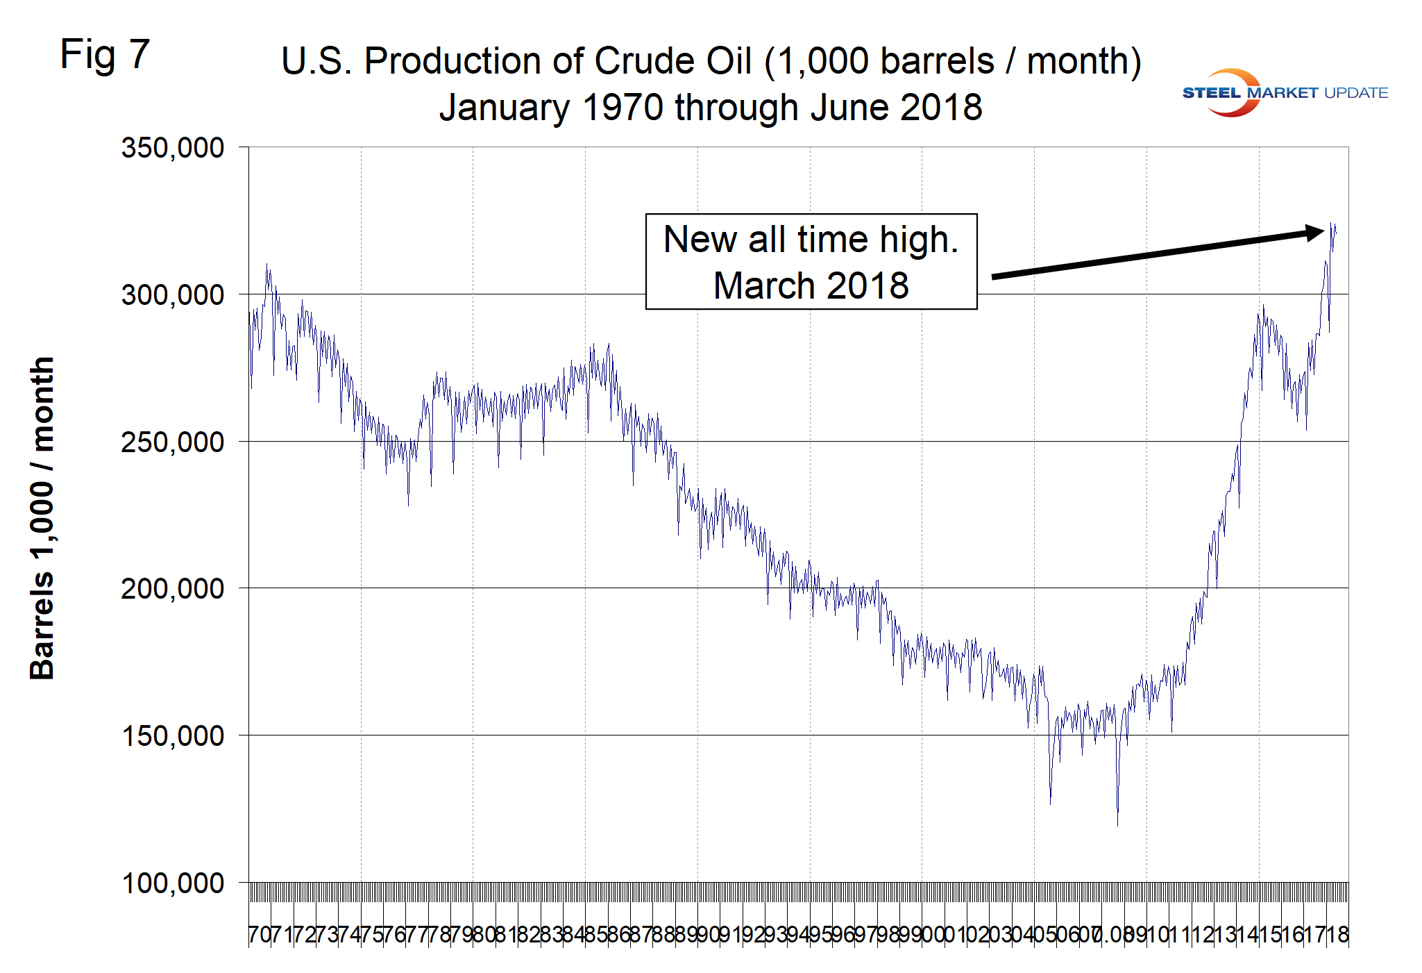
Figure 8 compares oil production and the oil rig count and shows how the increase in exploratory wells drove production from 2009 through late 2014 when the oil price collapsed. The subsequent decline in production was much less marked and is again increasing. Our take on this is that the huge increase in exploratory oil rigs beginning in 2009 may have been an anomaly and that we won’t see a repeat of the number operating in 2014 for a very long time.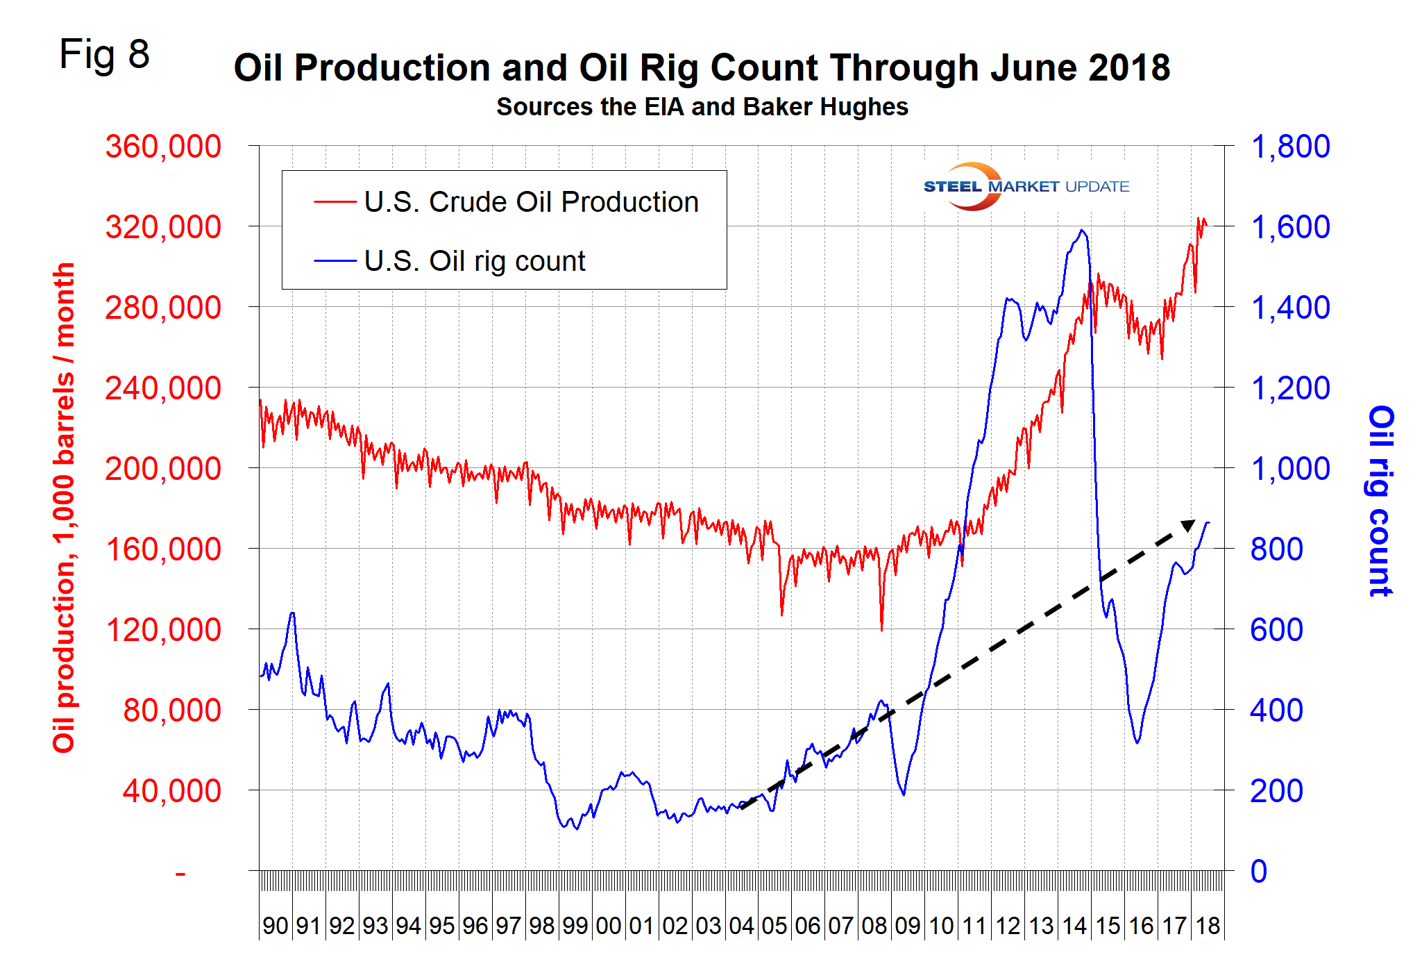
Baker Hughes Rotary Rig Count: This is a weekly census of the number of drilling rigs actively exploring for or developing oil or natural gas in the United States. Rigs are considered active from the time they break ground until the time they reach their target depth and may be establishing a new well or sidetracking an existing one. The Baker Hughes Rotary Rig count includes only those rigs that are significant consumers of oilfield services and supplies.


