

Market Data

January 16, 2020
Expanded SMU Steel Shipments and Inventories Report
Written by Peter Wright
Steel Market Update is pleased to share this Premium content with Executive-level members. For more information on how to upgrade to a Premium-level subcription, email Info@SteelMarketUpdate.com.
This month we have expanded our report on steel product downstream shipments and inventories to include total manufacturing. We are (but shouldn’t be) surprised by the result, which confirms other ratios we have developed for the way steel demand is whipsawed by the overall economy.
![]()
The Census Bureau provides monthly data on manufacturing inventories, shipments and new orders for total U.S. manufacturing and for individual industries, one of which is steel products. Therefore, the Census Bureau provides a useful reality check for steel industry trade association data, which is most widely used to assess the state of the industry.
Total shipments and inventories are reported in millions of dollars, seasonally adjusted. For the first time this month, our report includes a comparison between total manufacturing shipments and downstream steel products shipments. Year over year through November, total manufactured product shipments declined by 0.8 percent as steel product shipments declined by 11.9 percent. It was this discrepancy that surprised us. Figures 1 and 2 show the history of both since 1992.
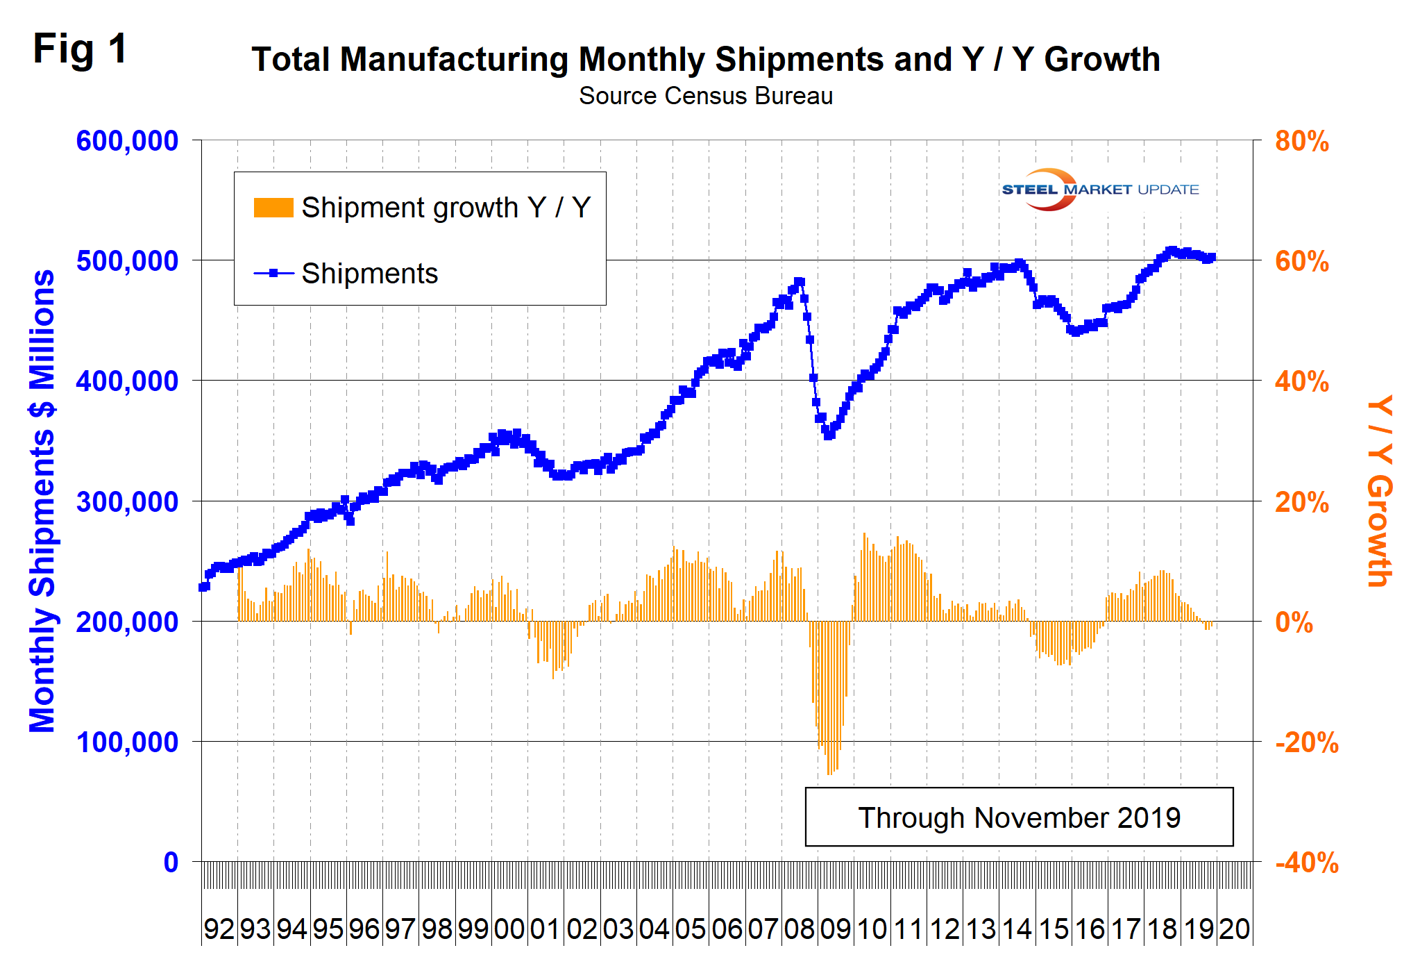
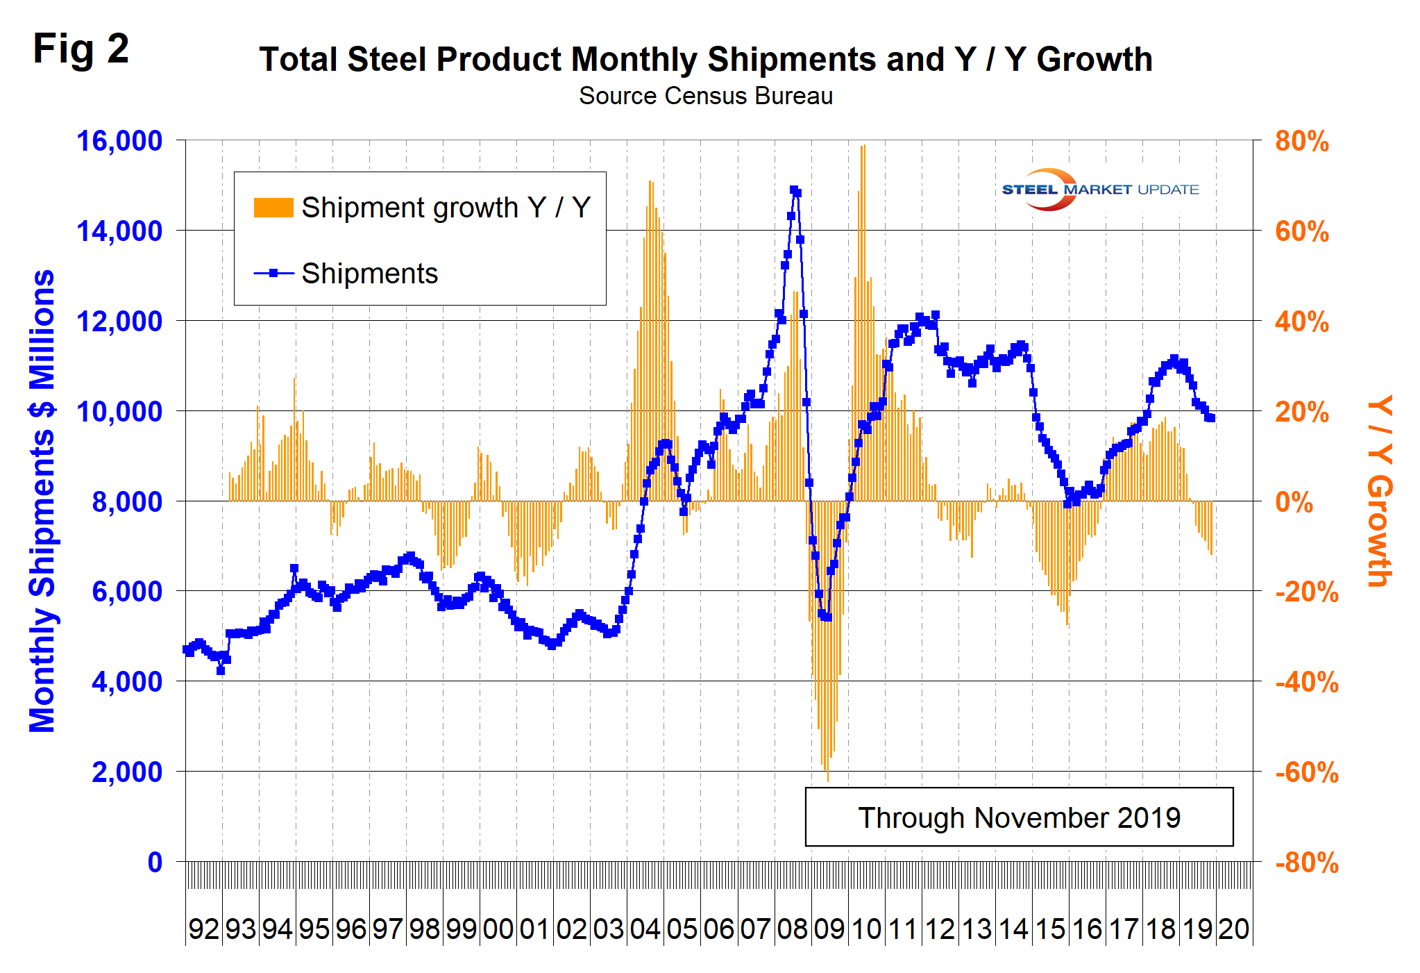
Please flick back and forth between these two graphs and note that the Y axis of year-over-year growth has the same scale. This is what we shouldn’t be surprised by because it mirrors the difference between the growth of apparent steel consumption and GDP. Steel consumption is much more sensitive to changes in the national economy than other industries, which is something subscribers to this newsletter live with year after year.
Census Bureau results for November were released on Jan. 7. Figure 2 shows monthly steel product shipments in millions of dollars since 1992 with the year-over-year growth. Shipments of steel products peaked in February 2019 and have since declined every month. The year-over-year growth rate has declined from 18.6 percent in August 2018 to negative 11.9 percent in November 2019.
The Census Bureau defines shipments as follows: “Manufacturers’ shipments measure the dollar value of products sold by manufacturing establishments and are based on net selling values f.o.b. (free on board) plant, after discounts and allowances are excluded. Freight charges and excise taxes are excluded. Multi-industry companies report value information for each industry category as if it were a separate economic unit. Thus, products transferred from one plant to another are valued at their full economic value.”
In our SMU reports, we aim to provide information on the same subject from different sources. The data in Figure 2 compares quite well over the long term with the AISI weekly crude steel production shown in Figure 3. Figure 2 is in dollars and Figure 3 is in tons, but the shape of the curves is comparable. The AISI weekly tonnage had a recent bottom in w/e Oct. 5 last year on a four-week moving average basis as shown in Figure 3 and is current as of Jan. 11. We have expanded Figure 3 to show only the period January 2014 through Jan. 11, 2020, as shown in Figure 4.
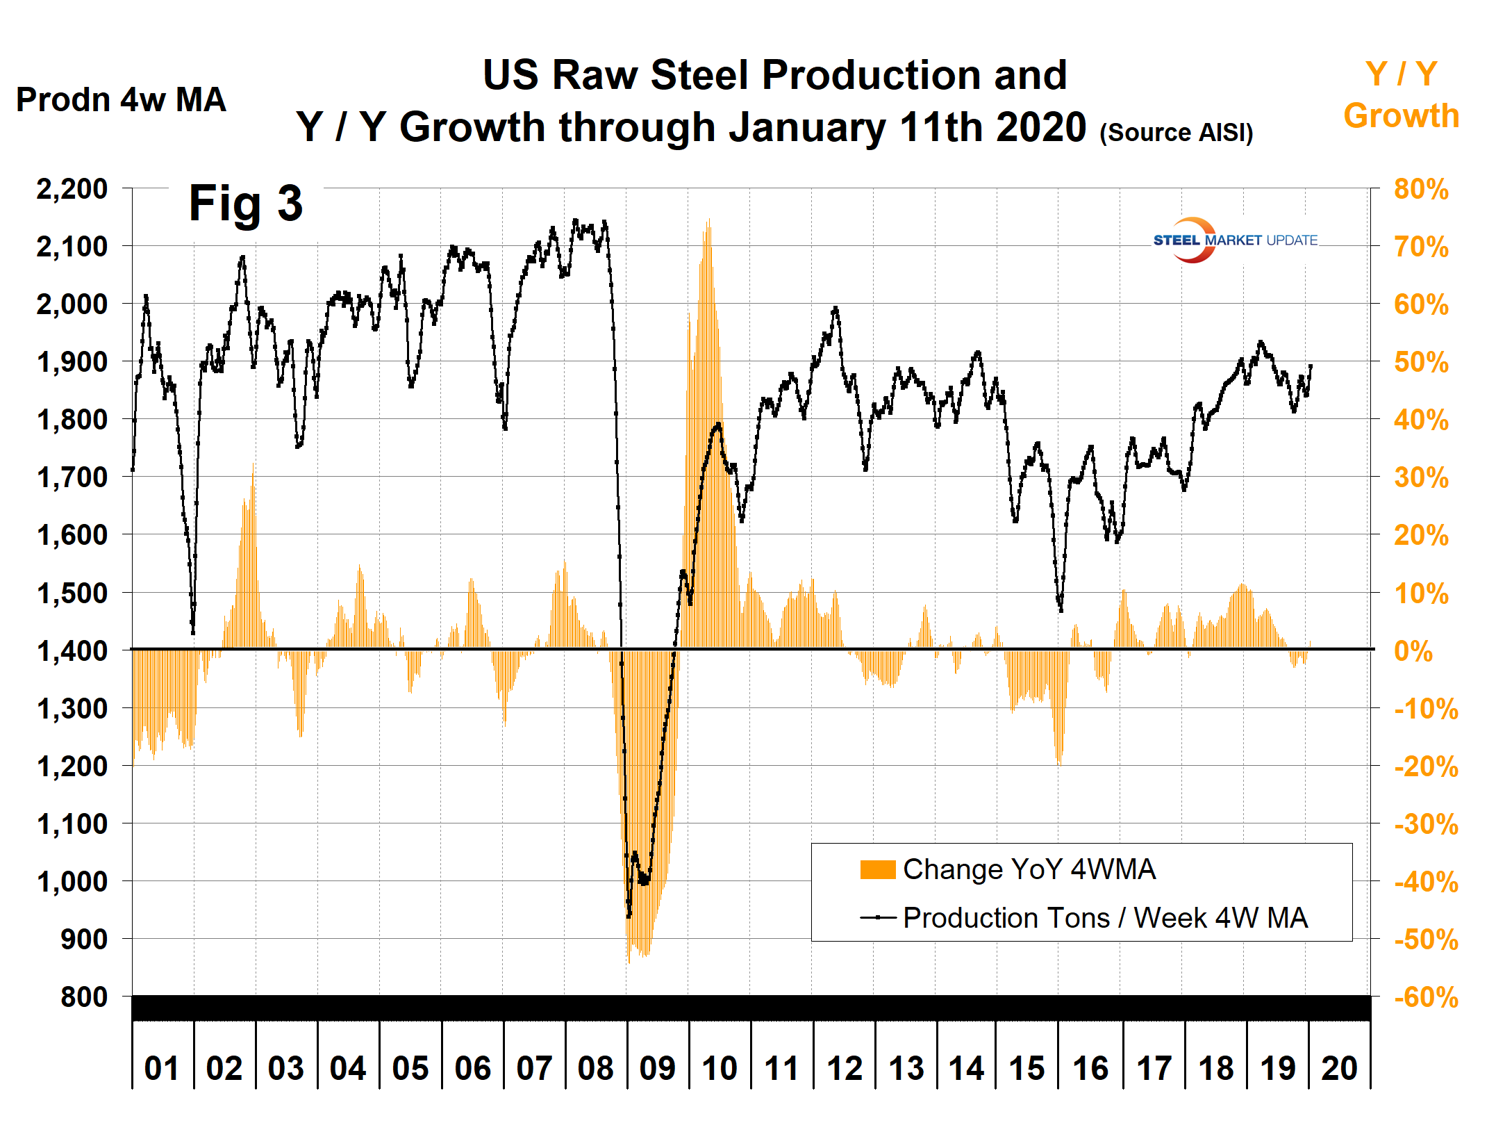
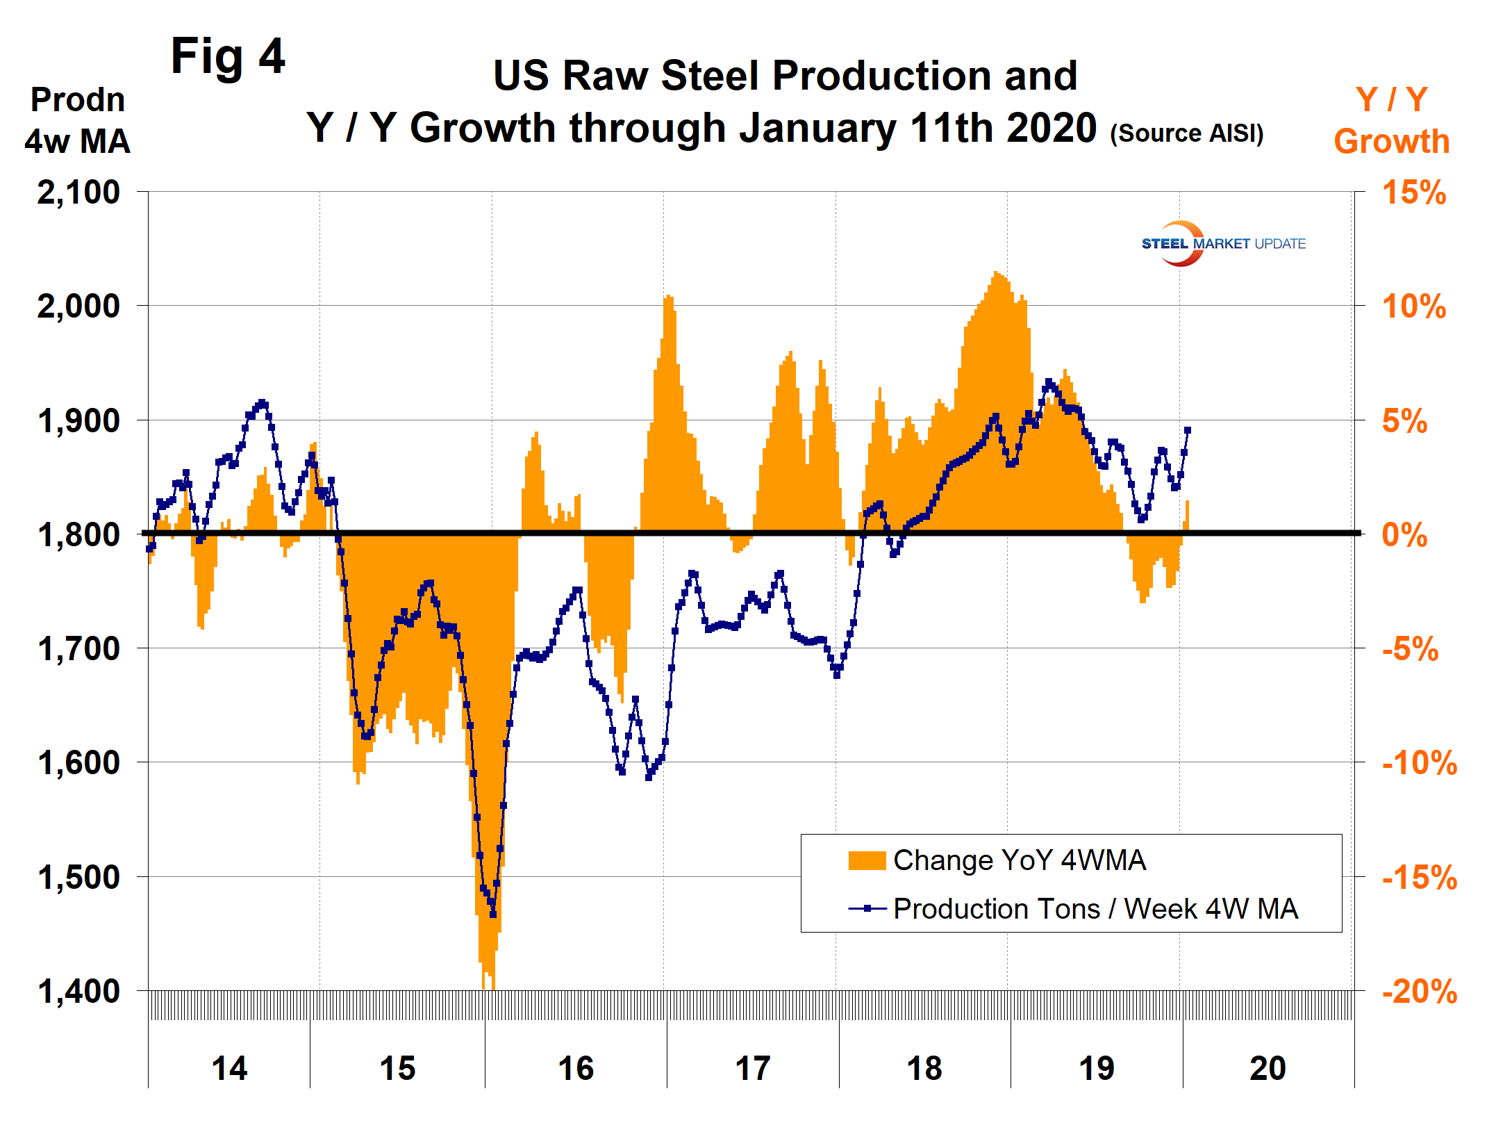
This highlights the steel recession of 2015, which is also clearly shown in the Commerce Department data in Figure 2. The AISI data is six weeks more current than the Commerce Department and shows a positive year-over-year growth in weeks ending Jan. 4 and Jan. 11 for the first time since Aug. 31, 2019. Since the Commerce Department data is for steel products and the AISI is for crude steel production, there is at least another two months difference in time frame. We can expect the Commerce data to show an improvement in the next few months.
Figure 5 shows shipments and new orders on a monthly basis for all steel products since 2010. New orders exceeded shipments in the six months June through November, which would seem to lead into the improved AISI data through Jan. 11.
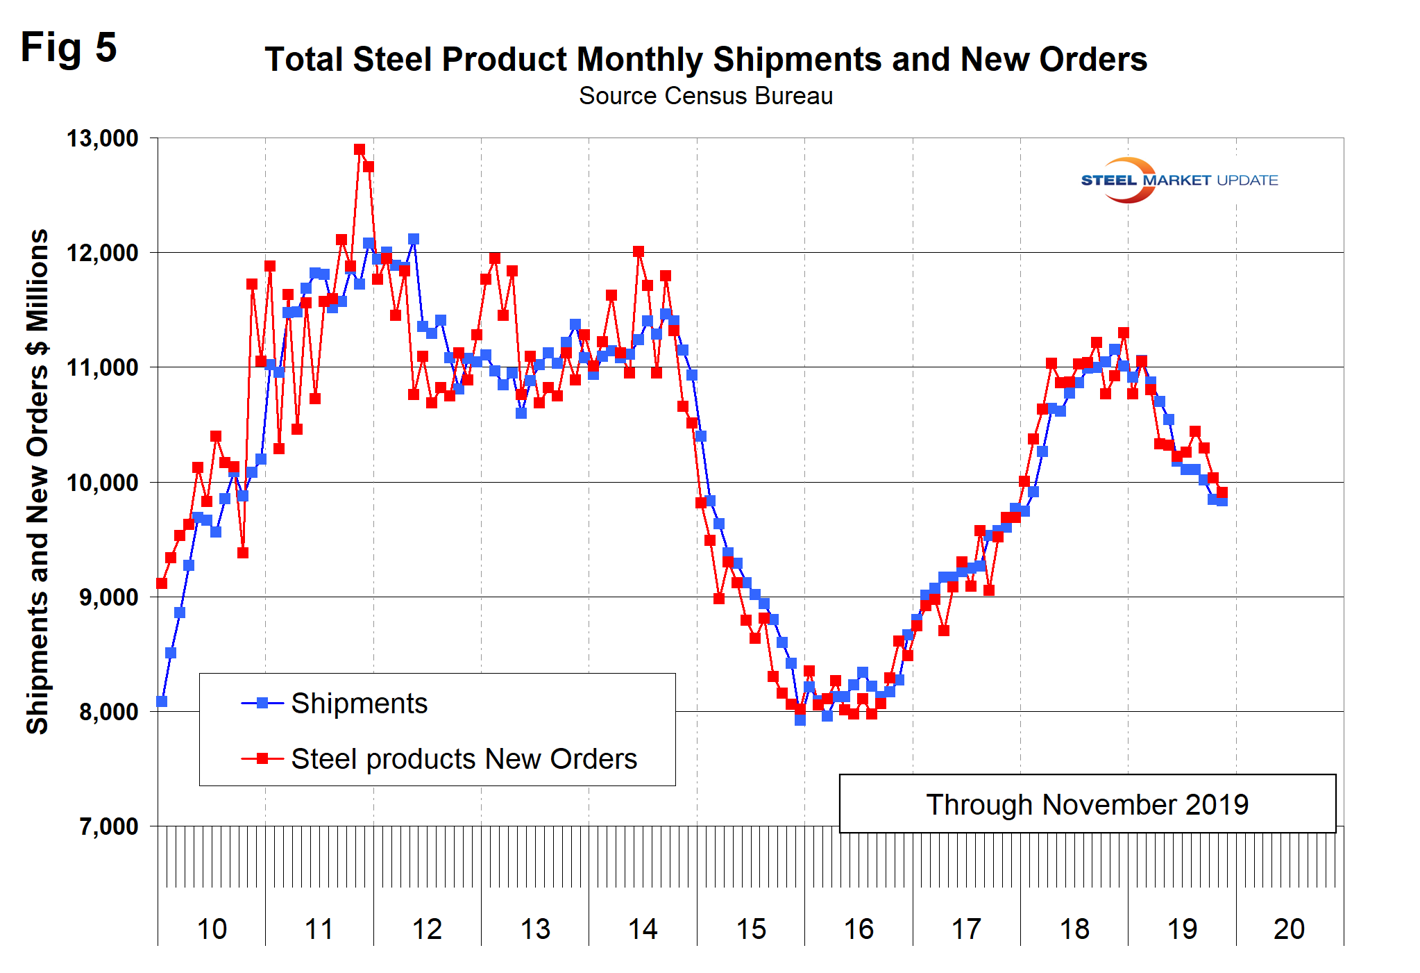
Figure 6 shows the same total shipment line as Figure 2, but now includes the inventory-to-shipment ratio. The IS ratio increased for over a year, but in November was down from its peak in August.
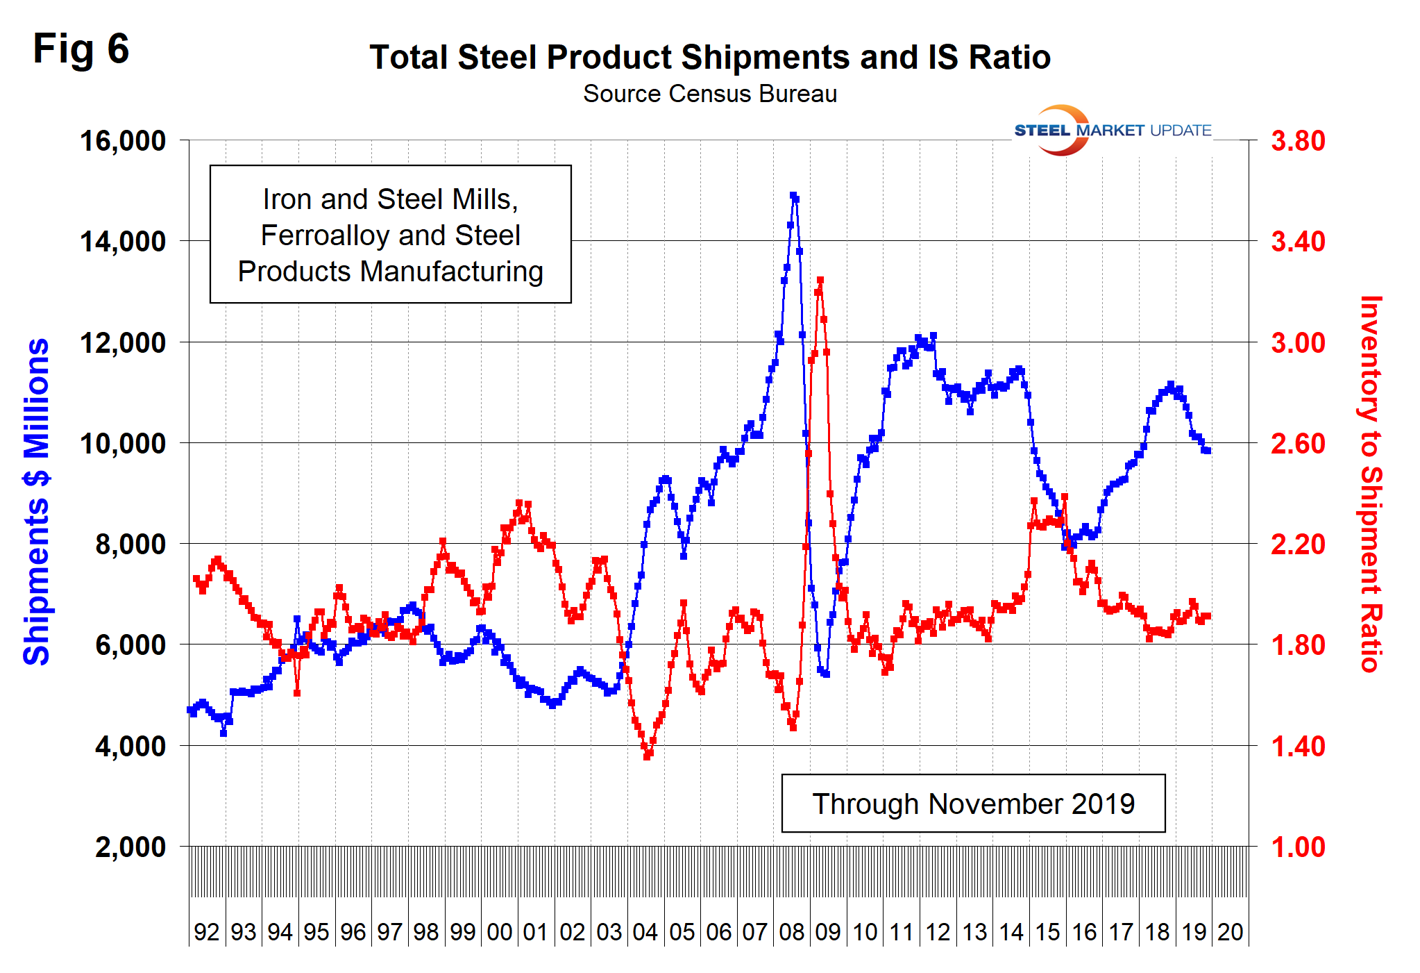
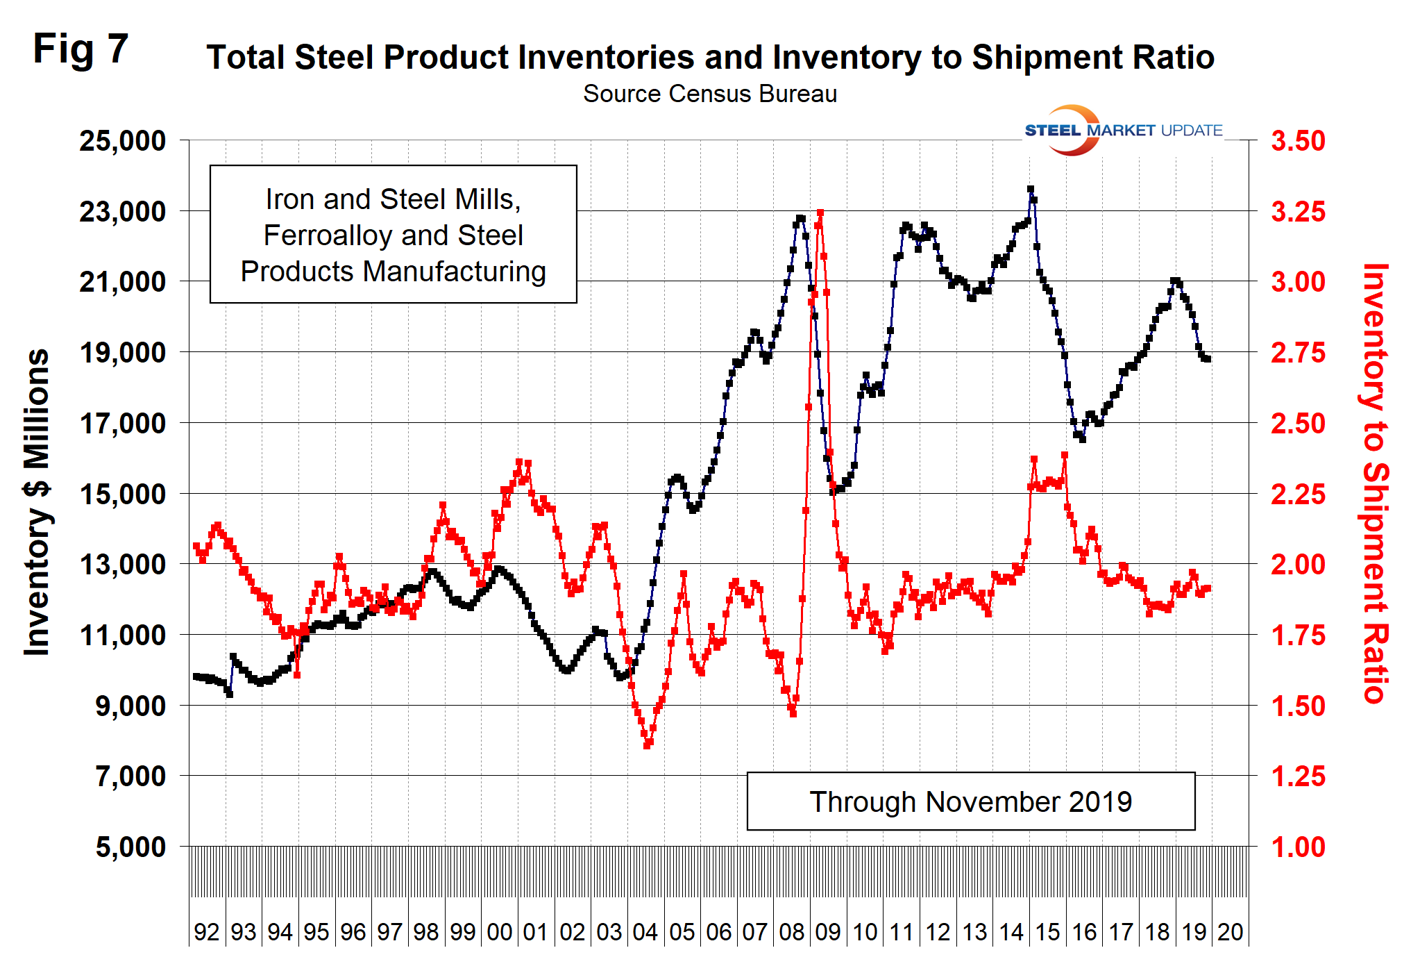
Figure 7 shows total inventory in millions of dollars and repeats the inventory-to-shipment ratio shown in Figure 6. Inventories have declined in parallel with shipments.
SMU Comment: Data from the Census Bureau for steel product orders, shipments and inventories shows a slowing market in 2019, but is several months in arrears compared with AISI data for weekly steel production. Both data sources are telling the same story, therefore our reality check is good and shipment reports for products manufactured from steel will improve in the next few months. This is another way of saying that we believe the AISI data for crude steel production, which is showing strong growth at present with a capacity utilization of 82.5 percent.


