Market Data

August 25, 2016
Durable Goods Orders Rebound in July
Written by Sandy Williams
Durable goods orders gained 4.4 percent in July following two months of declines, according to the latest report by the Commerce Department. The rebound was led by a surge in commercial aircraft orders which soared 90 percent after a 50 percent tumble in June. Nearly all categories comprising the new orders index showed increases in July. When excluding the volatile transportation category, the new orders index rose 1.5 percent.
Core capital goods orders, a proxy for business investment, increased 1.6 percent on stronger demand for business equipment and machinery. July shipments for core capital goods were down 0.4 percent.
The rise in new orders bodes well for future shipments but July shipments were down 0.2 percent following a 0.5 percent increase in June. Shipments and new orders for primary metals and fabricated metal products both increased in July.
Inventories of manufactured durable goods increased 0.3 percent in July.
The Advance Report on Durable Goods Manufacturers’ Shipments, Inventories and Orders July 2016 is reprinted below and can be accessed with accompanying charts from the Census site here.
New Orders
New orders for manufactured durable goods in July increased $9.7 billion or 4.4 percent to $228.9 billion, the U.S. Census Bureau announced today. This increase, up following two consecutive monthly decreases, followed a 4.2 percent June decrease. Excluding transportation, new orders increased 1.5 percent. Excluding defense, new orders increased 3.8 percent. Transportation equipment, also up following two consecutive monthly decreases, led the increase, $7.5 billion or 10.5 percent to $78.9 billion.
Shipments
Shipments of manufactured durable goods in July, up three of the last four months, increased $0.4 billion or 0.2 percent to $232.9 billion. This followed a 0.5 percent June increase. Computers and electronic products, up four consecutive months, drove the increase, $0.4 billion or 1.5 percent to $27.1 billion. Unfilled Orders Unfilled orders for manufactured durable goods in July, down two consecutive months, decreased $0.8 billion or 0.1 percent to $1,126.6 billion. This followed a 0.9 percent June decrease. Transportation equipment, also down two consecutive months, drove the decrease, $1.9 billion or 0.2 percent to $772.2 billion.
Inventories
Inventories of manufactured durable goods in July, up following six consecutive monthly decreases, increased $1.2 billion or 0.3 percent to $383.0 billion. This followed a 0.1 percent June decrease. Transportation equipment, up following five consecutive monthly decreases, led the increase, $0.5 billion or 0.4 percent to $123.7 billion.
Capital Goods
Nondefense new orders for capital goods in July increased $6.6 billion or 10.2 percent to $71.6 billion. Shipments increased less than $0.1 billion or virtually unchanged to $71.7 billion. Unfilled orders decreased $0.1 billion or virtually unchanged to $700.8 billion. Inventories decreased $0.3 billion or 0.2 percent to $169.1 billion.
Defense new orders for capital goods in July increased $2.5 billion or 35.7 percent to $9.6 billion. Shipments increased $0.1 billion or 1.1 percent to $10.3 billion. Unfilled orders decreased $0.8 billion or 0.6 percent to $136.0 billion. Inventories increased $0.8 billion or 3.9 percent to $21.1 billion.
Revised June Data
Revised seasonally adjusted June figures for all manufacturing industries were: new orders, $447.0 billion (revised from $447.4 billion); shipments, $460.2 billion (revised from $460.0 billion); unfilled orders, $1,127.4 billion (revised from $1,128.0 billion); and total inventories, $619.6 billion (revised from $619.1 billion).
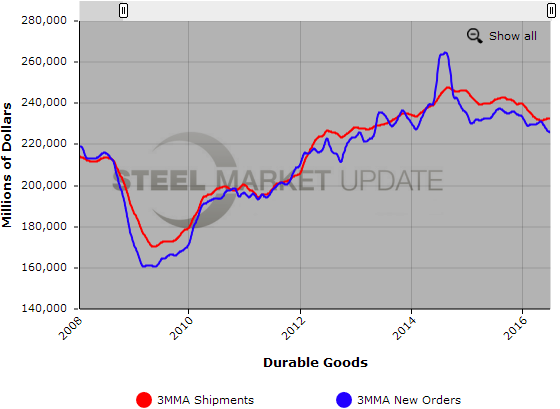
Below is a graph showing the history of durable goods shipments and new orders. You will need to view the graph on our website to use its interactive features, you can do so by clicking here. If you need assistance logging into or navigating the website, please contact our office at 800-432-3475 or info@SteelMarketUpdate.com.