

Market Data
March 16, 2014
Producer Price Indexes of Sheet Steel and Competing Materials
Written by Peter Wright
Each month the Bureau of Labor Statistics (BLS) puts out its series of producer price indexes for thousands of goods and materials. The latest release on Friday reported February results. These statistics are a useful way to evaluate any changes in the competitive position of steel against competing materials. See below for the official description of this program. The February report from the BLS began as follows, “Producer Price Index for final demand fell 0.1 percent in February, seasonally adjusted. This decline followed advances of 0.2 percent in January and 0.1 percent in December.
On an unadjusted basis, the index for final demand moved up 0.9 percent for the 12 months ended in February, the smallest 12-month rise since a 0.9-percent increase in May 2013. In February, the 0.1-percent decrease in final demand prices can be traced to the index for final demand services, which fell 0.3 percent. In contrast, prices for final demand goods advanced 0.4 percent. Within intermediate demand, the index for processed goods climbed 0.7 percent, prices for unprocessed goods jumped 5.7 percent, and the index for services rose 0.2 percent. Overall prices for finished goods declined 0.1 percent in November and 0.2 percent in October. At the earlier stages of processing, prices received by producers of intermediate goods rose 0.6 percent in December, and the crude goods index climbed 2.4 percent. On an unadjusted basis, prices for finished goods increased 1.2 percent in 2013 compared with a 1.4-percent advance in 2012.”
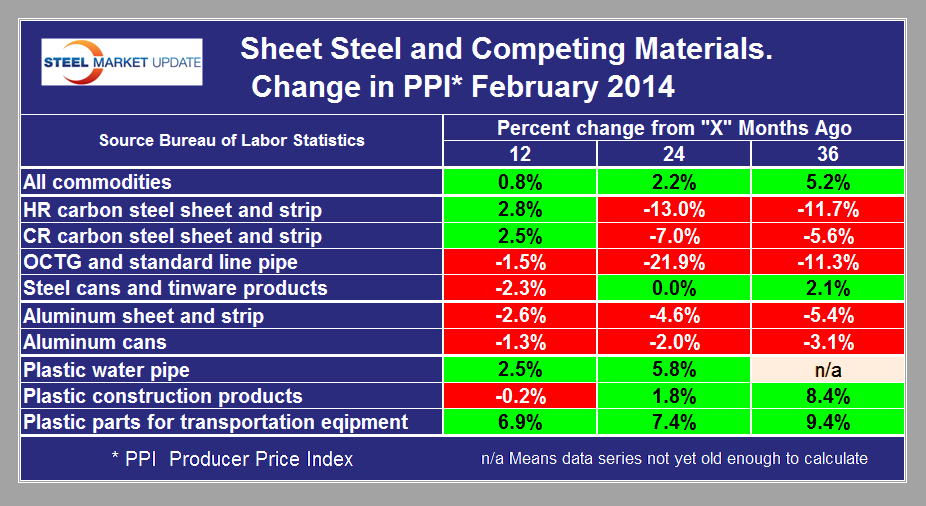
For the purpose of this report, SMU extracts comparative statistics for sheet steel, aluminum and plastic products. Table 1 is a summary of steel, aluminum and plastic indexes on a year over one, two and three year basis. One cell in this table contain the code n/a. In the last two years the BLS has expanded its range of products within the PPI series with the result that long term comparisons cannot yet be made in this product. What the PPI data shows is that the acceleration in commodity prices slowed to 0.8 percent in 12months through February. Over a 24 month period commodity prices were up by 2.2 percent and by 5.2 percent over 36 months. The price gyrations of hot and cold rolled sheet don’t bear much relation to the overall commodity grouping but have shown a reversal of fortunes in 12 months compared to 24 and 36 months. Steel cans and tin-ware products have moved favorably against aluminum cans in the last 12 months after years of declining competitiveness. Steel has become more competitive against plastic piping, construction products and construction equipment parts in the last 24 and 36 months.
The PPI data are helpful in monitoring the competitive price of steel and steel products against competing materials and products. As far as we at SMU can tell from comparison with known transaction prices, these PPI are a good representation of the real world.
Economy.com, a division of Moodys, reported as follows on Friday: “Headline producer prices fell in February, and the details in the report as well as market movements in recent weeks suggest further weakness is in store. Surging natural gas prices drove gains in finished energy goods and in some of the intermediate goods categories. However, these increases should fade once the harsh winter finally relents. Some of the growth related to basic materials could also prove short-lived. Worries about economic growth overseas will get in the way of sustained pricing power in the global supply chain. The sharp slowdown in China’s exports in February has drawn widespread concerns about growth in that country as well as the durability of the recovery in Europe, sinking commodity prices. Crude oil prices were up last month but have come under pressure in recent days as inventories have soared. Imports as well as domestic production have been rising as refineries cut back on crude oil purchases during seasonal maintenance, causing selloffs. Stronger global oil demand and difficulties in transporting crude oil should counter rising U.S. production over the coming year, allowing prices to rally modestly. Any signs that demand is not increasing strongly in the U.S. and China will quickly discourage traders, however, suggesting significant downside risk to prices. Minus steadier support from crude oil and other commodities, producer prices will fail to revive as expected in 2014.”
The next two paragraphs are extracted from Friday’s BLS report. The explanation of “Stage of intermediate demand is given at the end of this report.” Stages 1 and 2 are relevant to steel producers and processors.
Stage 2 intermediate demand (The stage 2 intermediate demand index measures price changes for products purchased by industries that primarily produce output sold to industries classified in stage 3.): The index for stage 2 intermediate demand jumped 4.2 percent in February, the largest increase since a 4.6-percent rise in January 2010. In February, prices for total goods inputs to stage 2 intermediate demand climbed 7.0 percent, and the index for total services inputs moved up 0.2 percent. Advances in the indexes for gas fuels, crude petroleum, primary basic organic chemicals, chemicals and allied products wholesaling, grains, and plastic resins and materials outweighed falling prices for loan services (partial), iron and steel scrap, and cellular phone and other wireless telecommunication services. For the 12 months ended in February, the index for stage 2 intermediate demand climbed 3.7 percent, the largest advance since a 5.6-percent increase for the 12 months ended July 2013.
Stage 1 intermediate demand (The stage 1 intermediate demand index measures price changes for products purchased by industries that primarily produce output sold to industries classified in stage 2.): The index for stage 1 intermediate demand rose 0.4 percent in February compared with a 1.0-percent jump in the prior month. In February, the index for total goods inputs to stage 1 intermediate demand advanced 0.7 percent, and prices for total services inputs moved up 0.2 percent. Increases in the indexes for primary basic organic chemicals, electric power, utility natural gas, chemicals and allied products wholesaling, gas fuels, and diesel fuel outweighed lower prices for iron and steel scrap, copper base scrap, and guestroom rental. For the 12 months ended in February, the index for stage 1 intermediate demand rose 1.2 percent.
The official description from the Bureau of Labor Statistics, (BLS) reads as follows: The Producer Price Index (PPI) is a family of indexes that measure the average change over time in the prices received by domestic producers of goods and services. PPIs measure price change from the perspective of the seller. This contrasts with other measures, such as the Consumer Price Index (CPI). CPIs measure price change from the purchaser’s perspective. Sellers’ and purchasers’ prices can differ due to government subsidies, sales and excise taxes, and distribution costs. More than 9,000 PPIs for individual products and groups of products are released each month. PPIs are available for the products of virtually every industry in the mining and manufacturing sectors of the U.S. economy. New PPIs are gradually being introduced for the products of industries in the construction, trade, finance, and services sectors of the economy. More than 100,000 price quotations per month are organized into three sets of PPIs: (1) Stage-of-processing indexes, (2) commodity indexes, and (3) indexes for the net output of industries and their products. The stage-of processing structure organizes products by class of buyer and degree of fabrication. The commodity structure organizes products by similarity of end use or material composition. The entire output of various industries is sampled to derive price indexes for the net output of industries and their products.
Stage-of-Processing Indexes: Within the stage-of-processing system, finished goods are commodities that will not undergo further processing and are ready for sale to the final-demand user, either an individual consumer or business firm. Finished consumer goods include durable goods such as automobiles, household furniture, and appliances, as well as nondurable goods such as apparel and home heating oil. Capital equipment includes durable goods such as heavy motor trucks, tractors, and machine tools.
The stage-of-processing category for intermediate materials, supplies, and components consists partly of commodities that have been processed but require further processing. Examples of such semi-finished goods include flour, cotton yarn, steel mill products, and lumber. The intermediate goods category also encompasses nondurable, physically complete items purchased by business firms as inputs for their operations. Examples include diesel fuel, belts and belting, paper boxes, and fertilizers.
Crude materials for further processing are products entering the market for the first time that have not been manufactured or fabricated and that are not sold directly to consumers. Crude foodstuffs and feedstuffs include items such as grains and livestock. Examples of crude nonfood materials include raw cotton, crude petroleum, coal, hides and skins, and iron and steel scrap.


