

Market Data

April 28, 2014
The Chicago Federal Reserve National Activity Index and Steel Supply
Written by Peter Wright
The following is an abridged version of the Chicago Federal Reserve statement plus our own graphical analysis. The Chicago Federal Reserve National Activity Index (CFNAI) is an excellent reality check for much of the economic analysis that we routinely provide in The Steel Market Update. An explanation of the index is provided at the end of this piece.
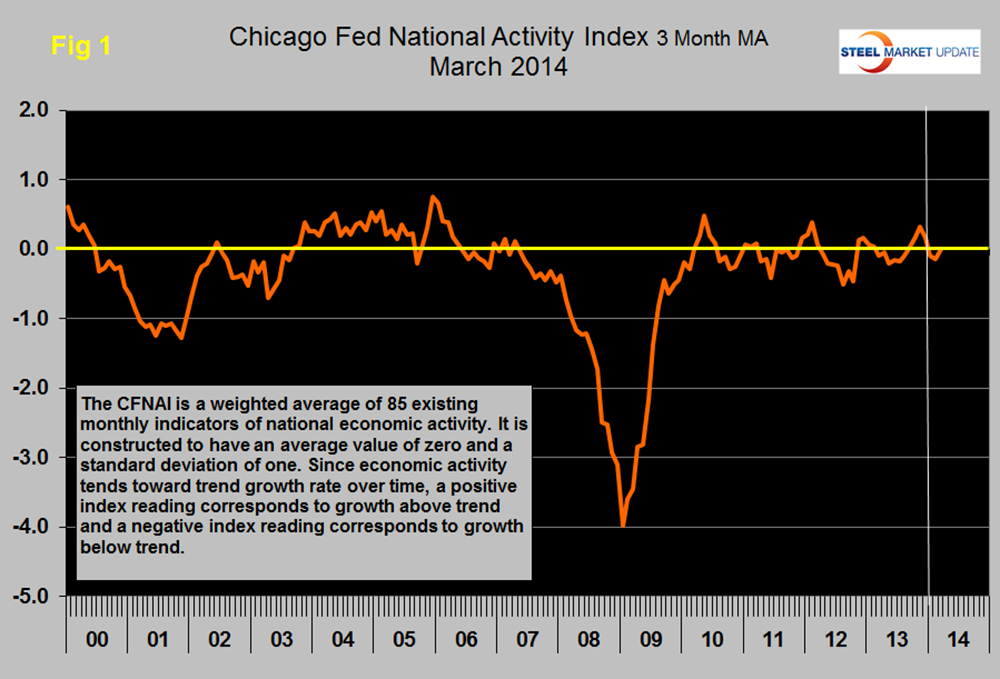
The official statement reads as follows: “The index’s three-month moving average, CFNAI-MA3, increased to a neutral reading in March from –0.14 in February, marking its third consecutive non-positive value, (Figure 1). March’s CFNAI-MA3 suggests that growth in national economic activity was at its historical trend. The economic growth reflected in this level of the CFNAI-MA3 suggests limited inflationary pressure from economic activity over the coming year. Fifty-one of the 85 individual indicators made positive contributions to the CFNAI in March, while 34 made negative contributions. Thirty-three indicators improved from February to March, while 51 indicators deteriorated and one was unchanged.
Production-related indicators contributed +0.21 to the CFNAI in March, down from +0.54 in February. Industrial production increased 0.7 percent in March after rising 1.2 percent in February, and manufacturing output moved up 0.5 percent in March after increasing 1.4 percent in the previous month, (Figure 2). Note; Figure 2 plots three month moving averages so doesn’t align precisely with the official comments.
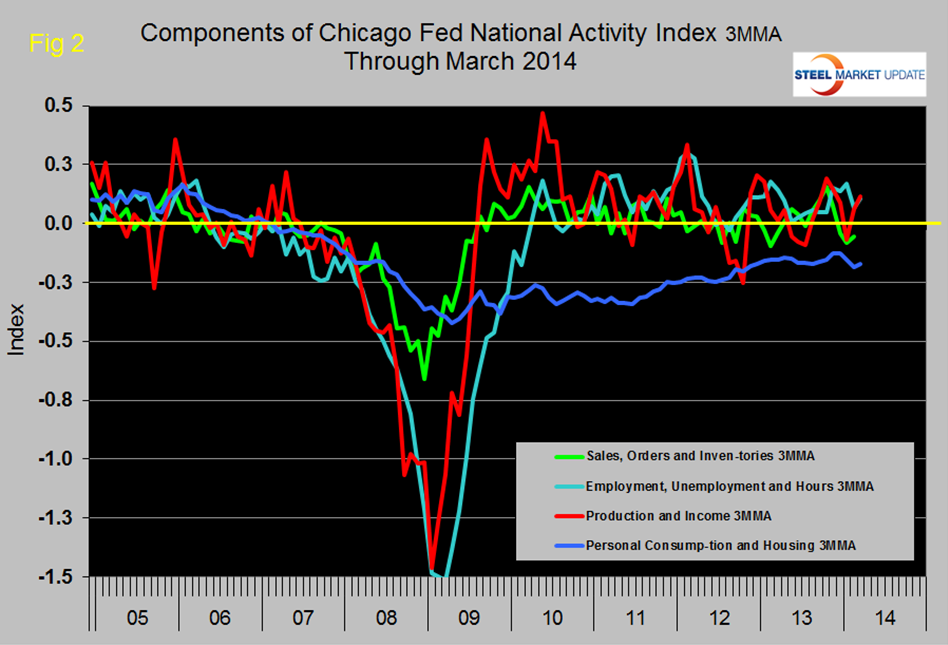
Employment-related indicators contributed +0.14 to the CFNAI in March, up from +0.07 in February. Average weekly initial claims for unemployment insurance decreased to 320,900 in March from 336,900 in February. Civilian employment increased 0.3 percent in March after roughly no change in February, while nonfarm payrolls increased 0.1 percent in March for the second straight month.
The contribution from the consumption and housing category to the CFNAI moved up to –0.13 in March from –0.17 in February. Housing starts increased to 946,000 annualized units in March from 920,000 in February, but housing permits declined to 990,000 annualized units in March from 1,014,000 in the previous month.
The contribution from the sales, orders, and inventories category to the CFNAI decreased to –0.02 in March from +0.08 in February.
The CFNAI was constructed using data available as of April 16, 2014.
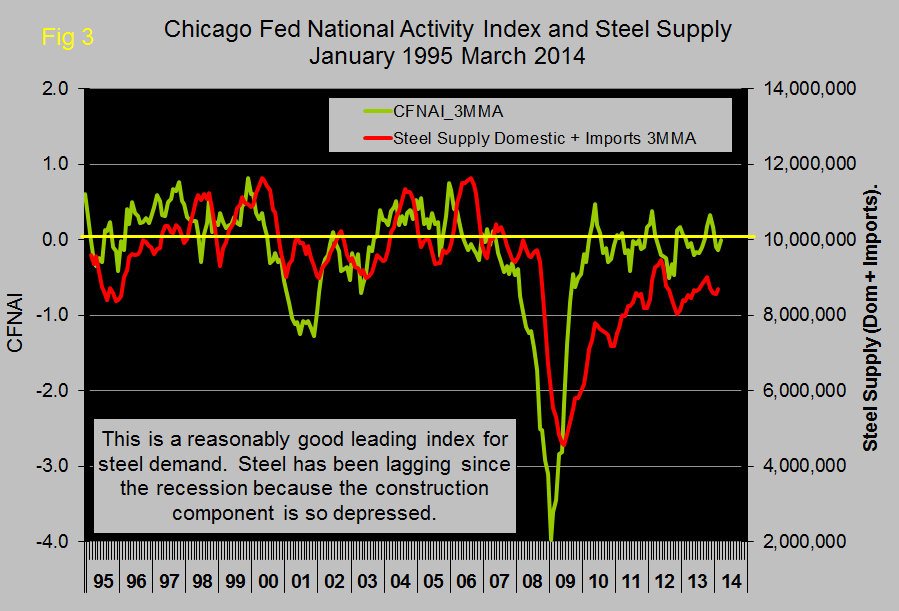
Figure 3 shows that the CFNAI has historically been a reasonably accurate leading indicator of steel demand, (apparent supply) with a lead time of about six months. This is one of several benchmark indicator that shows steel demand has not recovered to its traditional level since the recession. We believe this to be a measure of the extent to which construction, (or lack there-of) is still a drag on steel demand.
Explanation: the index is a weighted average of 85 indicators of national economic activity drawn from four broad categories of data: 1) production and income; 2) employment, unemployment, and hours; 3) personal consumption and housing; and 4) sales, orders, and inventories. A zero value for the index indicates that the national economy is expanding at its historical trend rate of growth; negative values indicate below-average growth; and positive values indicate above-average growth. When the CFNAI-MA3, (three month moving average) value moves below –0.70 following a period of economic expansion, there is an increasing likelihood that a recession has begun. Conversely, when the CFNAI-MA3 value moves above –0.70 following a period of economic contraction, there is an increasing likelihood that a recession has ended. When the CFNAI-MA3 value moves above /+0.70 more than two years into an economic expansion, there is an increasing likelihood that a period of sustained increasing inflation has begun.


