Analysis

May 21, 2014
Summary of the Housing Situation
Written by Peter Wright
The housing market is struggling. Even though the steel content of housing is only a small proportion of total steel consumption, housing is a leading indicator of many construction sectors, such as non-residential and sub sectors of infrastructure, and has a large multiplier effect in the economy as a whole. Existing home sales dipped again in March to their lowest levels since early in 2012. This was the 8th consecutive monthly decline.
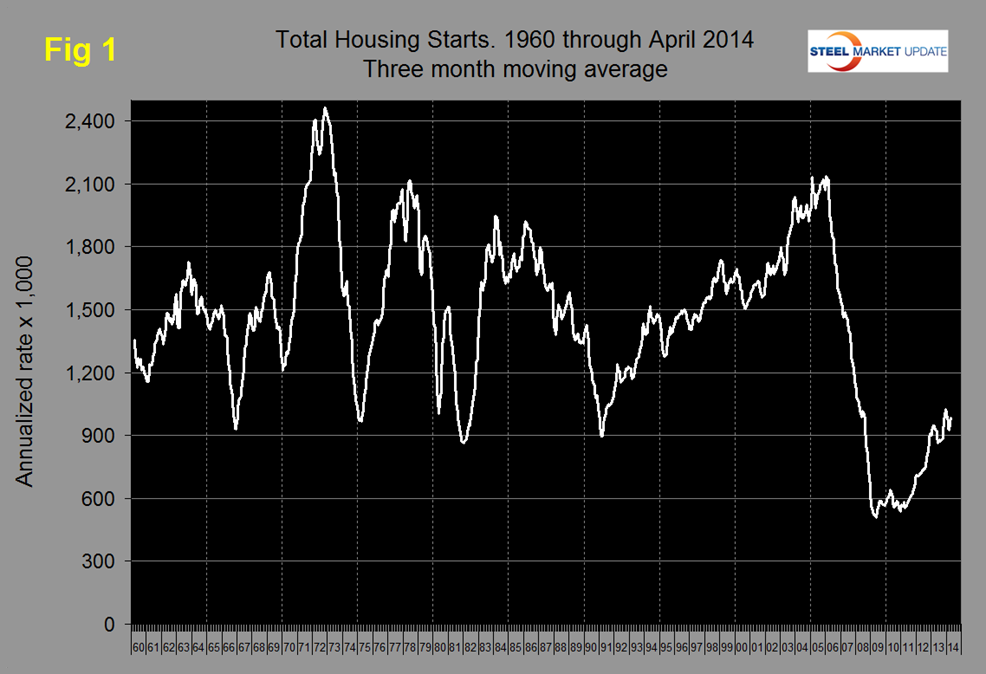
Figure 1 shows total residential starts back to 1960 and illustrates that the current market, even after five years of recovery, is still typical of all recessions prior to the big one in 2008. Considering the population increase in the last 50 years, a true recovery is still not in sight.
The joint news release from the U.S. Census Bureau and the Department of Housing and Urban Development reported that sales of new single-family houses in March 2014 were at a seasonally adjusted annual rate of 384,000. This is 14.5 percent below the revised February rate of 449,000 and is 13.3 percent below the March 2013 estimate of 443,000. The median sales price of new houses sold in March 2014 was $290,000; the average sales price was $334,200. The seasonally adjusted estimate of new houses for sale at the end of March was 193,000. This represents a supply of 6.0 months at the current sales rate.
Armada Executive Intelligence Brief made the following comments; Existing home sales are running at an annual rate of 4.59 million units, well short of the 7.26 million unit rate that we hit in September of 2005. The housing sector is one of the greatest multipliers of economic activity in the US economy (and globally for that matter). Pressure on consumers is leading to a reduction in housing activity. Some speculative reasons that housing may be slowing despite an increase in general economic activity include: Institutional investors have slowed their purchase of housing inventory. Foreign investors are also slowing their purchases of residential property – partly due to the slowdown in economic activity in China. US consumers are still finding it difficult to get financing for a mortgage. Those who can be approved are having a difficult time getting down payment funds to make the purchase. Pressure on reduced housing prices has reduced the equity in homes. Sellers cannot discount prices enough to attract buyers (banks are requiring a much greater percentage of money down to hit debt to equity ratios). Ten thousand baby boomers turn 65 every day (many will retire). That changes the type of house that they have an interest in – and not all of the existing homes in inventory meet those conditions. The monthly supply of homes in the US available for sale continues to remain somewhat historically low. Current inventory sits at a 5 month supply. The types of jobs that we are creating are not the jobs that are helping to push volumes in the housing market. There are too few income earners at the top end to grow new home demand. And, those jobs created at the bottom end of the wage scale likely can’t afford to purchase a home or wouldn’t qualify for a loan.
April permits and starts. The extraordinary starts and permits data reported in March did not extend into April which bounced back to a positive 4.8 percent and 6.3 percent, respectively, on a 3MMA basis. Table 1 shows permits and starts data for the period Feb – April compared to the same period last year.
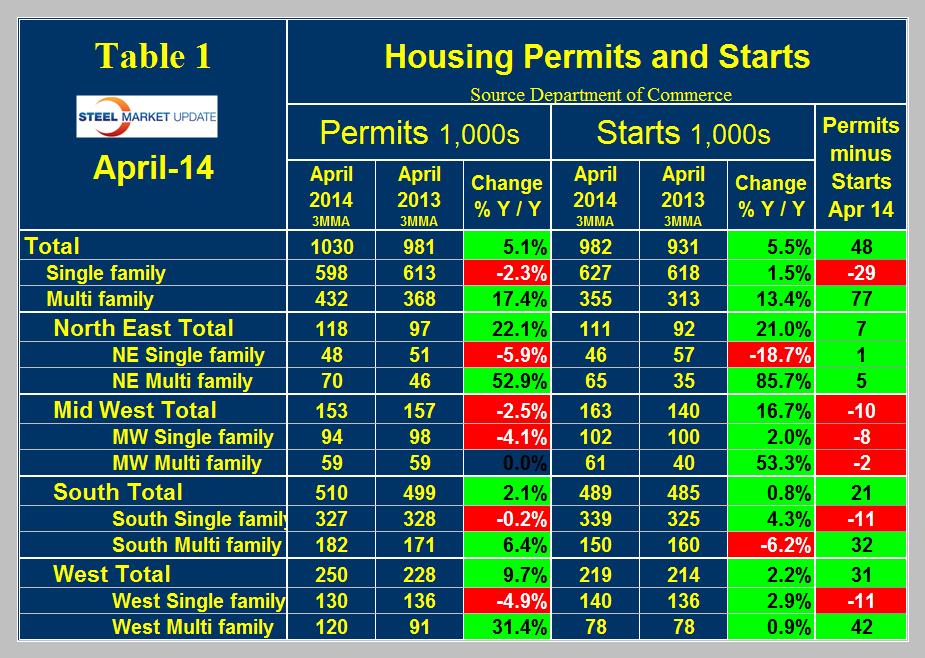
On this basis, permits grew by 5.1 percent and starts by 5.5 percent. Once again the strength was all in multifamily units, (apartments) which had double digit growth of both permits and starts. Permits for single family contracted by 2.3 percent and starts grew by 1.5 percent. Permits of single family were 29,000 less than starts, which we regard as a bad harbinger of future growth. Nationally single family residential starts continue to lack direction. There is no sign that the trajectory that existed from Q2 2102 through Q1 2013 and which seems to have been de-railed by the increase in mortgage interest rates will be re-gained any time soon, (Figure 2).
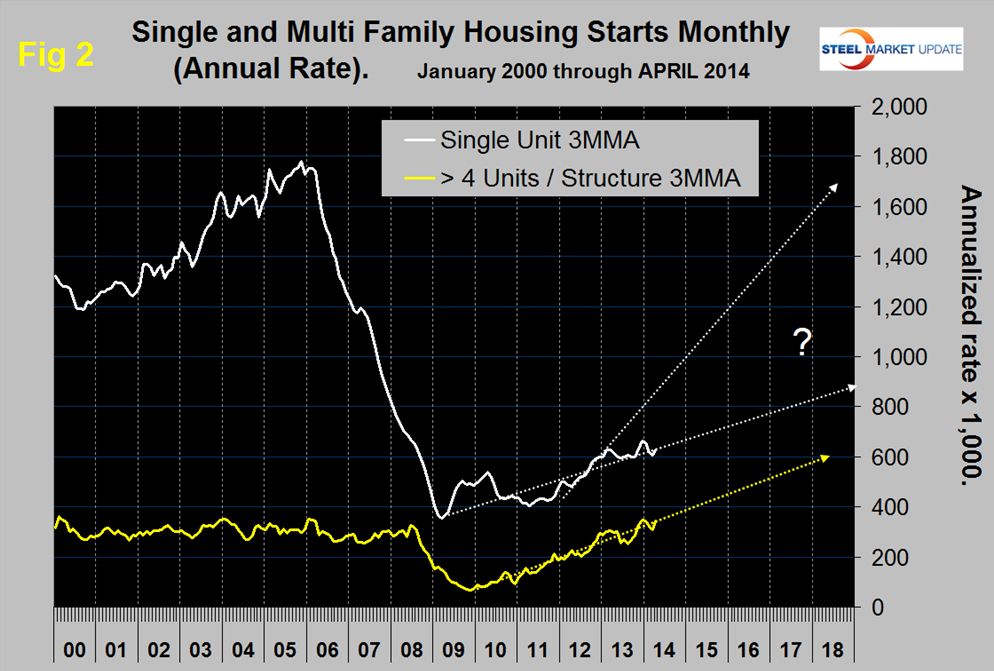
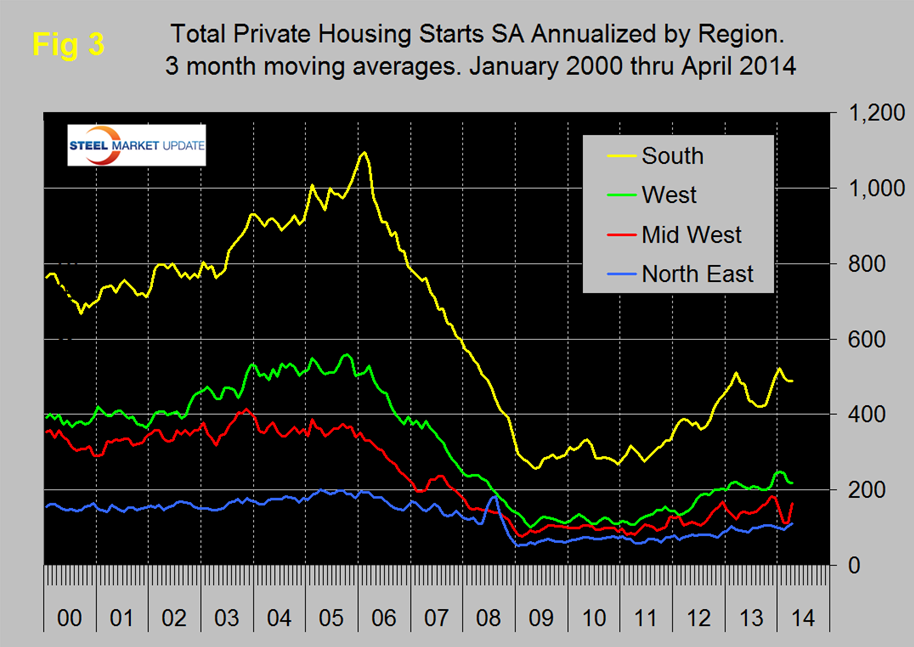
Some pundits are forecasting a return to a one million rate for single family starts this tear. To us at SMU, based on current trends it looks more like 2020 before that level will be re-gained, particularly considering that interest rates have only one direction to go. Multi-family starts are approaching the high point of the last 25 years which is resulting in the ratio of single to multi-family units continuing to fall. It seems inescapable now that we are witnessing a significant shift in buyer’s perception when it comes to the choice between single family ownership and apartment rental. The balloon in student loan debt is one of the fuels of this trend. On a regional basis the Mid-West and North-East are playing catchup but again all the strength is in multi- family. Total starts in the West and South were up by only 2.2 percent and 0.8 percent respectively. Figure 3 shows total housing starts for four regions.
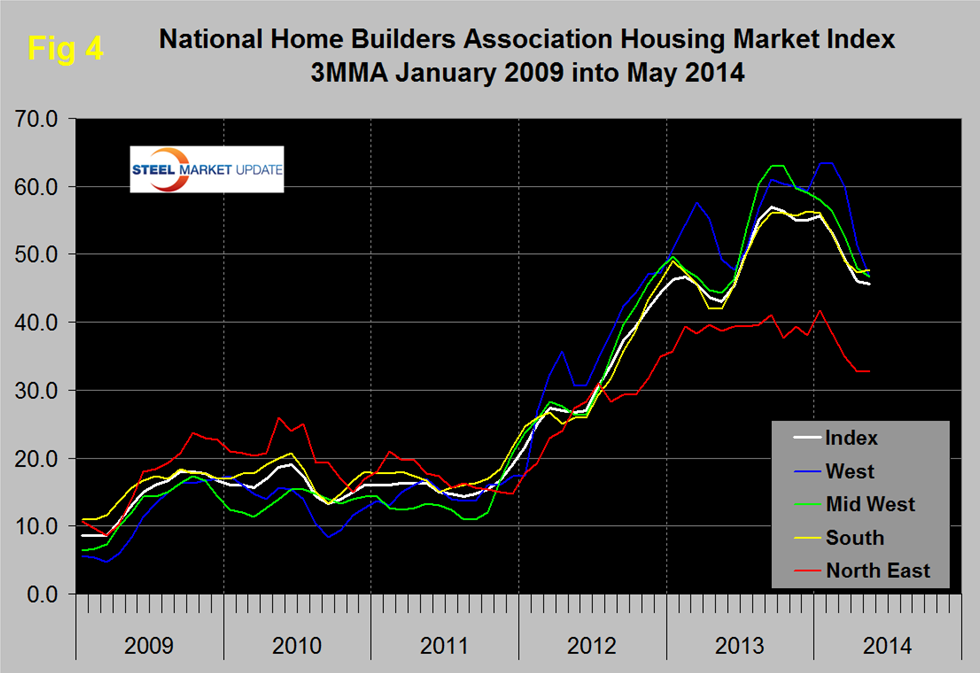
The National Home Builders Association, (NHBA) released their builder’s confidence data for May on Thursday. The national index declined one point to 46, and the three month moving average, (3MMA) has been below 50 for three straight months after a string of eight months > 50. Sentiment is back where it was twelve months ago before borrowing costs took a hike. In addition price appreciation is dampening demand. Regionally, house prices increased the most in the Pacific Coast and South Atlantic, where employment and income growth has outperformed that in the rest of the nation. Despite the rise in March, price growth will likely slow over the next several quarters as investor demand cools, leaving traditional homebuyers using credit to pick up the slack. The NHBA prospective buyers’ traffic index has declined since the summer and was at 33 in May. A value <50 indicates that more builders regard the market as unfavorable than favorable. On a 3MMA basis builder confidence has been declining across all regions for all of this year and all regions are currently <50 with the North East being by far the weakest, (Figure 4).