Prices

July 3, 2014
Questions About Steel Imports Analysis
Written by John Packard
Steel Market Update participates in a number of social forums including one of our own which is hosted on LinkedIn. Our LinkedIn group name is: Steel Market Update and if you are a LinkedIn member you are invited to join.
We received the following questions after posting one of our articles about May imports on our Blog and to our LinkedIn group:
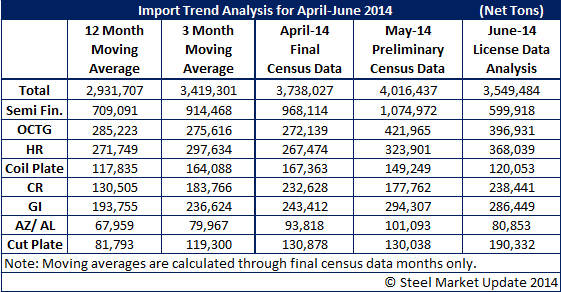
I know that many of us would like to know the following: In regard to your chart of Import Analysis for April-June 2014, I would greatly appreciate the SMU definition of your “Moving Average”, and the calculation used to arrive at the Moving Average and moving over what period of time. In your chart “Import Forecast…” please supply the source number that your forecast are based upon and the formula you use to arrive at the forecast you arrive at.
What does the “license data” represent? Does it represent the actual imports imported during the month shown?
We are certain that all are aware that one month or even 3 months does not represent anything more than a short term trend. These numbers are similar to the weekly report of US domestic capacity utilization. First, they are not 100 percent accurate and, second, they have an effect on decision making for the long term or short term. They are only the results of past actions and decisions.
SMU Response to the LinkedIn Steel Market Update group inquiry was as follows:
Our 3 & 12 month moving averages are calculated by using “Final” Census Data as provided by the Steel Import Monitoring & Analysis System (part of the US Department of Commerce). The most recent final census data is through the month of April as the May numbers are Preliminary Census Data and subject to minor revisions.
This means our 3MMA is for February, March and April 2014 and our 12MMA begins in May 2013 through April 2014.
Since the majority of our readers are located in North America we convert the SIMA data into net or short tons (2,000 pounds per net ton) from metric tons.
We add up the totals for each month (example: February + March + April) and then divide by three to get our moving average.
We have written articles on the accuracy of the SIMA License Data with perhaps the best article on the subject being one written by David Phelps, previous president of the American Institute for International Steel (AIIS). The link to that article which we have posted in our blog for everyone to read is here (click on the link to access).
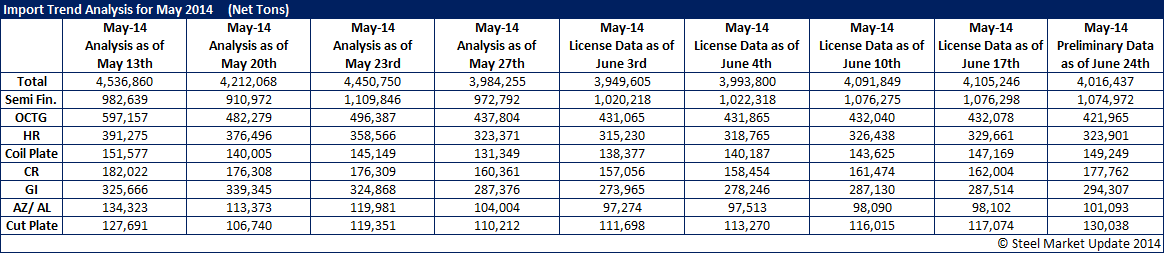
When you look at the import license data the articles we write for our newsletter, take the data with a grain of salt. For example, we produce an analysis every Tuesday evening after the SIMA data is released. We take the number of days of data and then calculate the daily average volume and multiply that average by the total number of days in a month. Early in the month, we report that the data “suggests” imports at “approximately” such and such a level (generally lower than what our mathematical equation is telling us). But, we provide the data and let our readers decide what information they want to use in their own analysis. As the month progresses we attempt to hone in on a number – for example, we have been reporting that the trend for June suggests the month will be about 3.5 million net tons in imports which would be down 500,000 from the Preliminary Census numbers being reported for May.
Below is our weekly progression table showing what the license data was suggesting as the trend for the month of May. We began calculating the trend on the 13th of May and then continued through the Preliminary Census Data which was released earlier this week. (Click the image for a larger view)
We are changing the title to our tables to “Trends Analysis” from Forecast as the word forecast is misleading and not our intention. When looking at the tables those months showing Final Census Data are just that, the final SIMA (US Department of Commerce) numbers. Preliminary Census Data is produced about 1 to 2 weeks prior to the final census number and tends to be a fairly accurate accounting. License Data can vary and only suggests a trend in the flow of the imports for a specific month. Here is how we will begin showing our tables in the future:
We totally agree that what we are reporting is the ‘trend” for imports (or weekly production which is based on only 50% of the domestic steel mills responding). However, as companies work through their buying and selling decisions they need to be aware of (in this case imports) what the trend looks like and if it will impact their need to buy or sell steel (and at what price).
I hope our explanation is helpful. We also produce a report for our Premium Level subscribers (and free trials) where we provide imports by product, port and country. These reports are based on Final Census Data and other government data which is not easily available.
We will have a segment of our Steel Summit Conference on September 3 & 4 dedicated to foreign steel issues with Roger Schagrin (attorney for the steel industry) and Lewis Leibowitz (attorney for consumer groups) along with Paul Lowrey of Steel Research Associated (consultant to the steel mills). Details can be found on the SMU website.