

Analysis

October 19, 2014
US Vehicle Sales & NAFTA Vehicle Production
Written by Peter Wright
Light vehicle sales in the US declined in September to 16.4 million units from the blistering 17.5 million rate in August, both on a seasonally adjusted annualized basis. The spread between light trucks and autos increased to one million units in favor of light trucks. The third quarter pace was Ta very strong 16.8 million units.
Sales declined very little month / month for Ford and General Motors and improved for Chrysler. As a result, the U.S. brand market share increased from 44 percent to 46 percent. Month / month sales declined for Nissan, Honda and Toyota and their total market share declined from 35 percent to 31 percent. Toyota’s sales were down year over year. In the third quarter the market share of imports declined to 21 percent from 22 percent in Q2. Moody’s Analytics expects vehicle sales to remain well above 16 million units in the near term and approach near 17 million units in 2015.
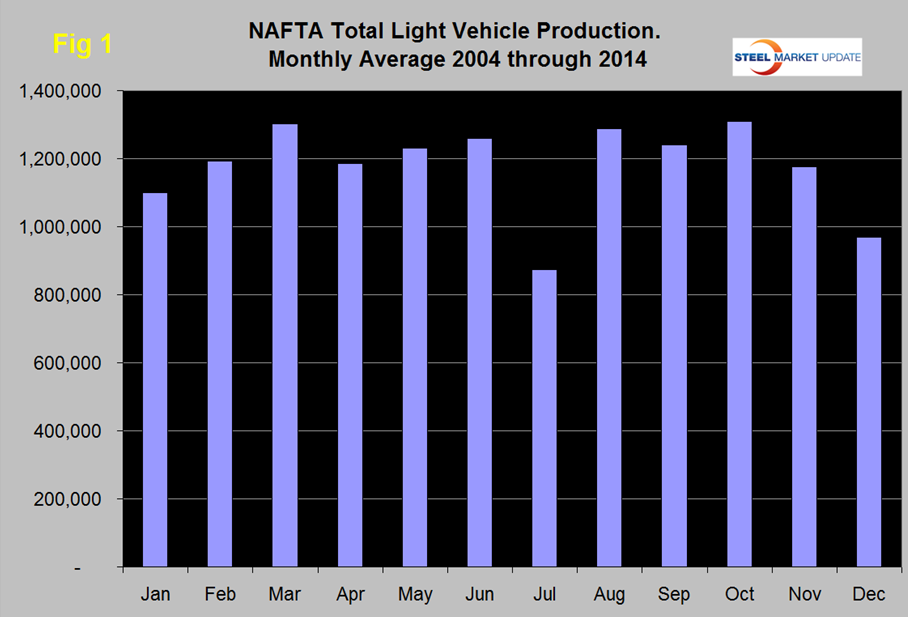
Total light vehicle production in NAFTA in September was at an annual rate of 17,774,000 units, up by 4.1 percent from August. On average since 2004, September production has declined 3.6 percent from August, (Figure 1). Note: these production numbers are not seasonally adjusted, the sales data reported above are seasonally adjusted.
On a rolling 12 months basis y/y light vehicle production in NAFTA increased by 5.1 percent in September and is now well above the pre-recession peak, (Figure 2).
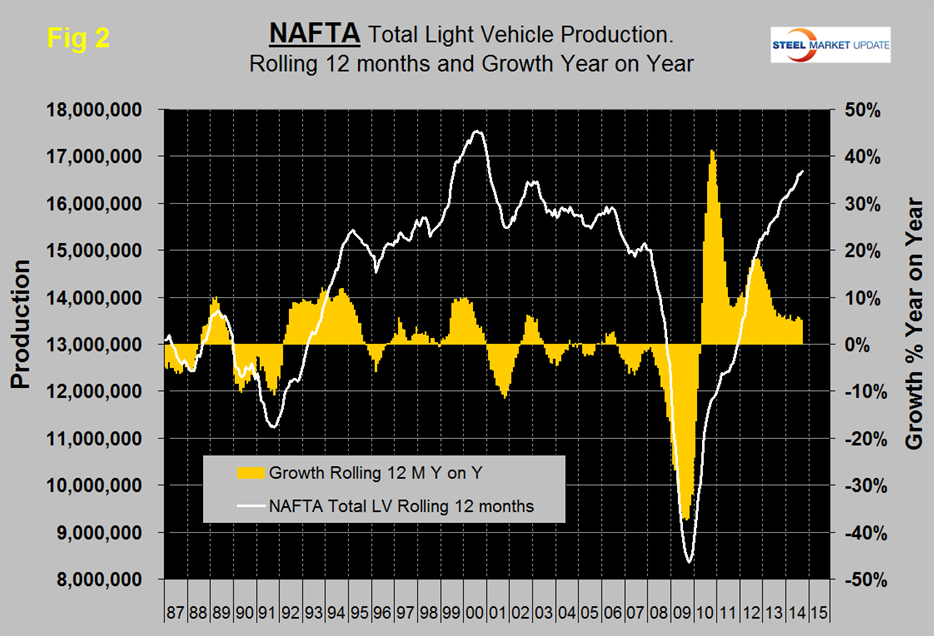
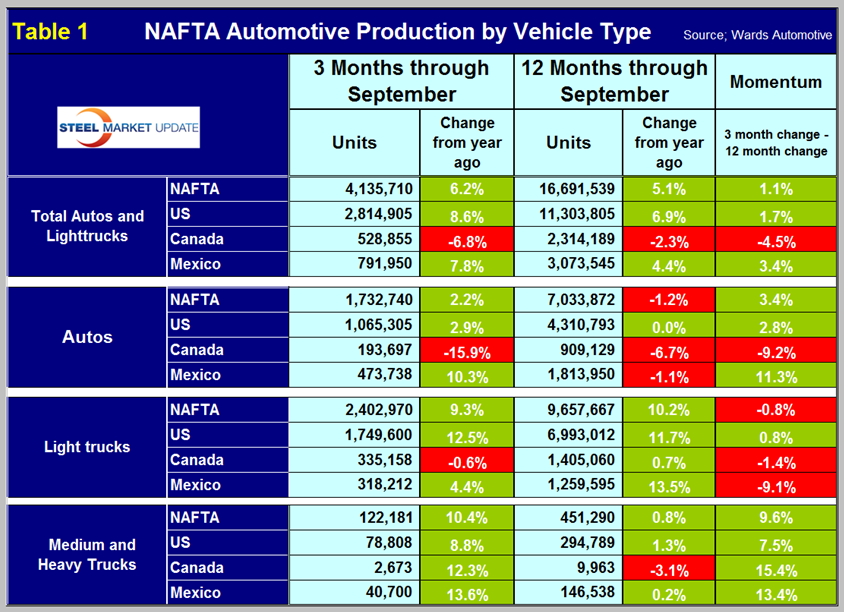
Growth has been solidly in the 5.5 percent range since August last year. On this basis the US is up by 6.9 percent, Canada is down by 2.3 percent and Mexico is up by 4.4 percent, (Table 1). For NAFTA as a whole on a rolling 12 month basis year over year, light truck production is up by 10.2 percent and autos are down by 1.2 percent.
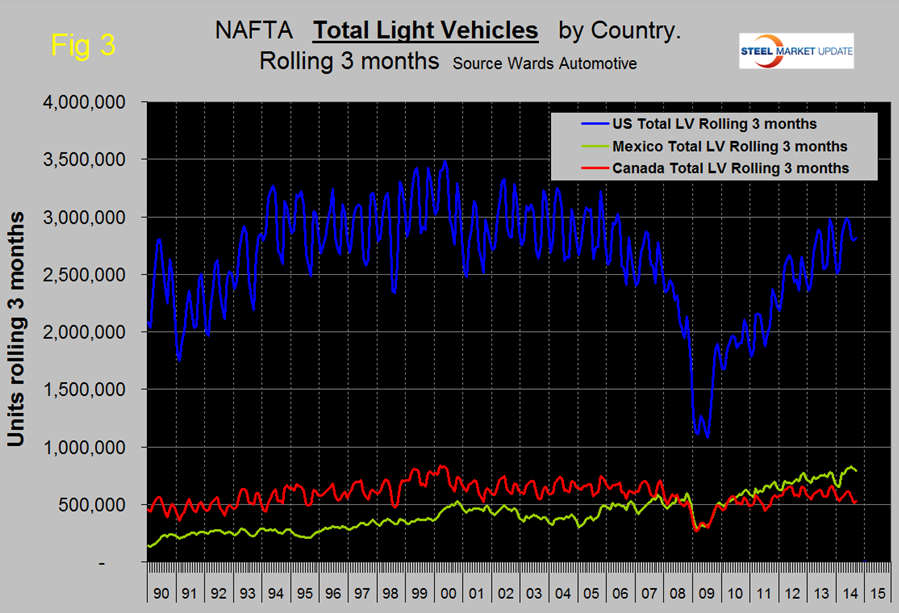
To put the production of the three NAFTA countries into perspective, US output of total light vehicles in the 3rd quarter was 5.3 times that of Canada and 3.6 times that of Mexico, (Figure 3).
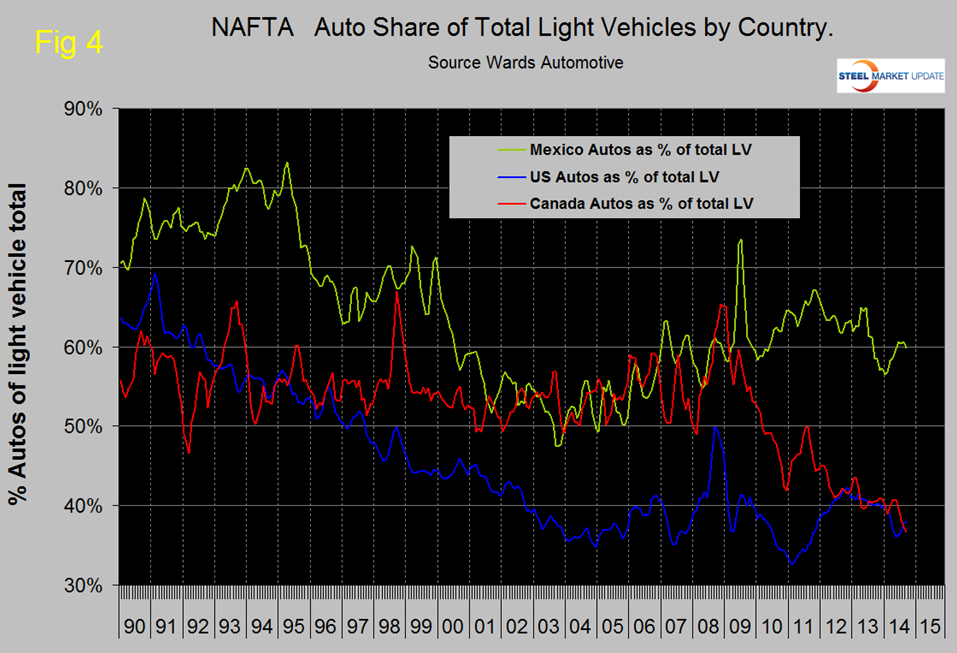
The mix of light vehicles is very different by country, (Figure 4). The percentage of autos in the Mexican mix is over 60 percent but only 37 percent in both the US and Canada.
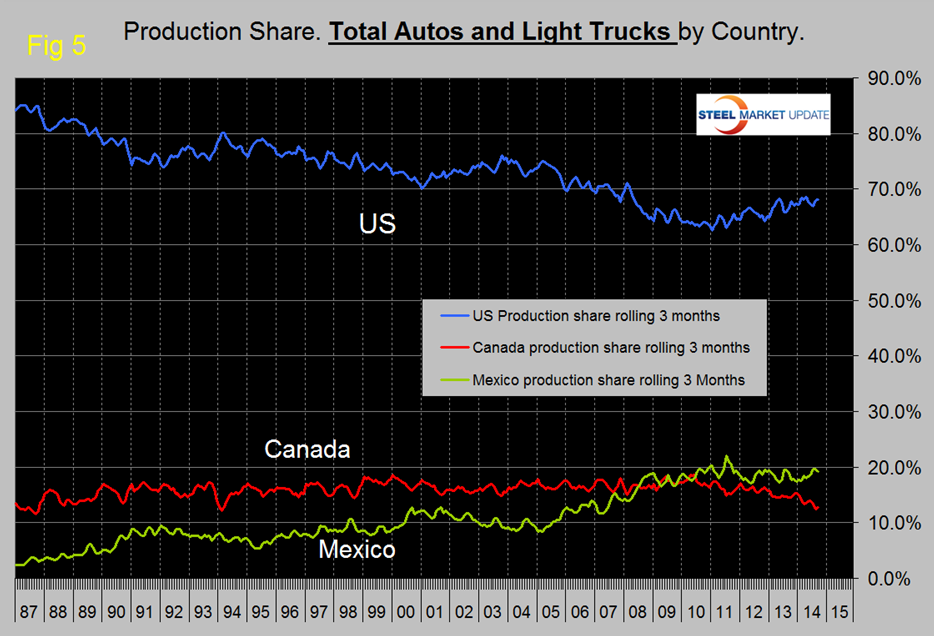
The US production share has been increasing for almost four years at the expense of Canada, Mexico’s share has been virtually unchanged in that time period, (Figure 5).
Ward’s Automotive reported last week that total light vehicle inventories in the US increased by nine days of sales in September to sixty four days. This is two higher than in September last year. Light vehicle inventories of the Detroit three increased by eight to seventy seven, the Asian manufacturers increased by eleven to fifty three, and the Europeans declined by two to fifty one.
The SMU data file contains more detail than be shown here in this condensed report. Readers can obtain copies of additional time based performance results on request if they wish to dig deeper. Available are graphs of auto, light truck and medium and heavy truck production, growth rate and production share by country.


