

Prices

March 22, 2015
Global Steel Production and Capacity Utilization in February 2015
Written by Peter Wright
Global steel production in 12 months through February totaled 1.628 billion tonnes with a capacity of 2.2 billion tonnes which yields a utilization for the 12 month period of 74 percent. China accounted for 51 percent of global production in February. Asia as a whole, including India, accounted for 68.4 percent of global production.
Production in February on a tons per day basis was 4.558 million tonnes which was the highest since June last year and broke a string of four consecutively declining months. Total February production was 127.626 million tonnes. If we look at the three month moving average and plot it over time we see that there has been a significant decline in the second half of the year since and including 2010 which usually extends into February, (Figure 1).
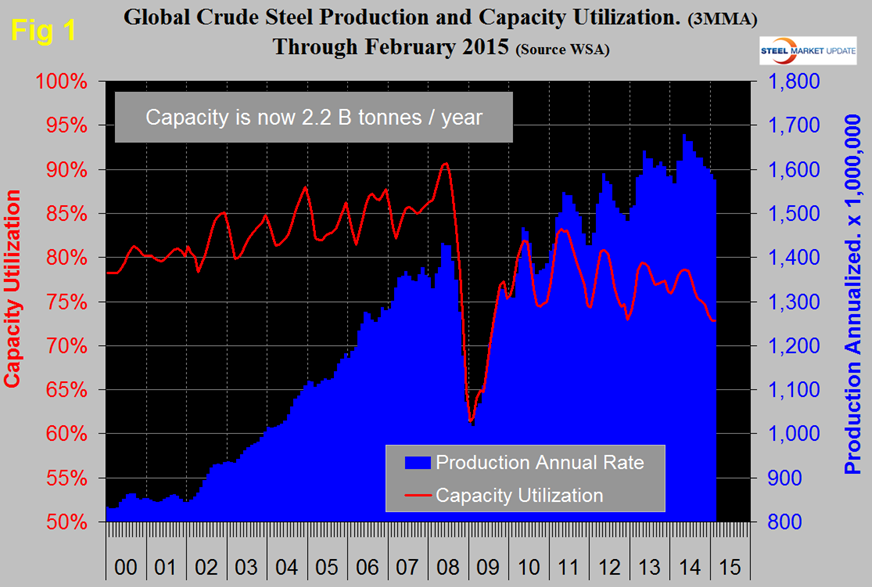
As production has increased each year since the recession, capacity utilization has decreased, the gap is widening. Much has been written about China’s desire to close up to 100 million tons of old environmentally unfriendly capacity. The following was a recent report; “Mills’ Closures have started in China as the government decided to tighten measures against environmental polluters. The first province to bear the consequences was Shandong with 45 mills being shut down completely, according to local press. There are 15 blast furnaces in the region with the capacity of 6-8 million metric tons per year. The next province expected to follow the suit is Hebei, though there has been no news regarding shutdowns yet. Mills that have not taken any steps to meet the environmental rules can be immediately shut down. About 70 percent of Chinese mills are not compliant with the new environmental standards, according to CISA. Market players, though, believe that the number is underestimated. It has not been estimated to what extent the closures will influence the yearly production, but most insiders believe that the crude steel output will dip this year, for the first time in over 30 years.”
Table 1 shows global production broken down into regions and also the production of the top ten nations in the single month of February and their share of the global total. It also shows the latest three months and twelve months production through February with year over year growth rates for each. Regions are shown in white font and individual nations in beige.
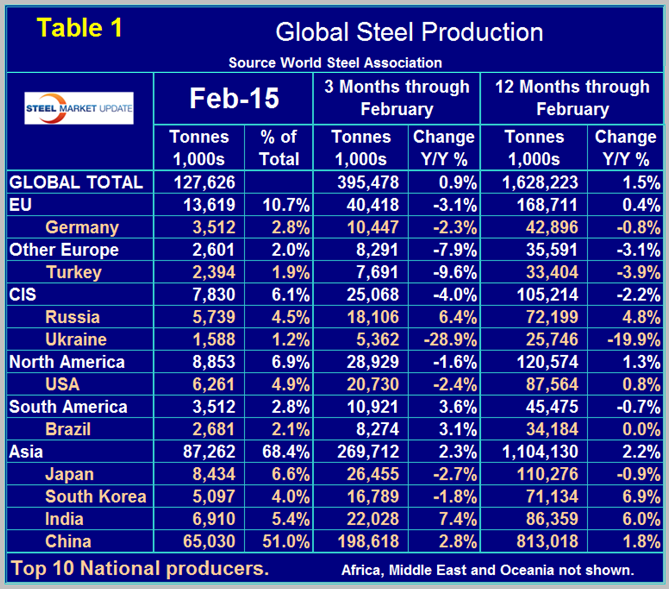
If the three month growth rate exceeds the twelve month we interpret this to be a sign of positive momentum and accelerating growth. The reverse is the case today though Asia and South America are bucking that trend. In three months through November year over year global growth declined to exactly zero, in three months through December it bounced back to 1.1 percent, in three months through January declined again to 0.2 percent and in three months through February recovered slightly to 0.9 percent. The growth rate in twelve months through February 2015 was 1.5 percent compared to twelve months through February last year. In the three months through February there were significant differences in regional year over year production. North America was down by 1.6 percent in total with the US down by 2.4 percent, Canada down by 1.8 percent and Mexico by 3.8 percent. The European Union was down by 3.1 percent and other Europe led by Turkey was down by 7.9 percent. Asia was up by 2.3 percent with declines in Japan and Korea and increases in China and India. The effect of the war in Ukraine is clear in the contraction of that country’s steel production. Figure 2 shows the 3MMA of the monthly year over year growth of global steel production which prior to December had been falling for six months.
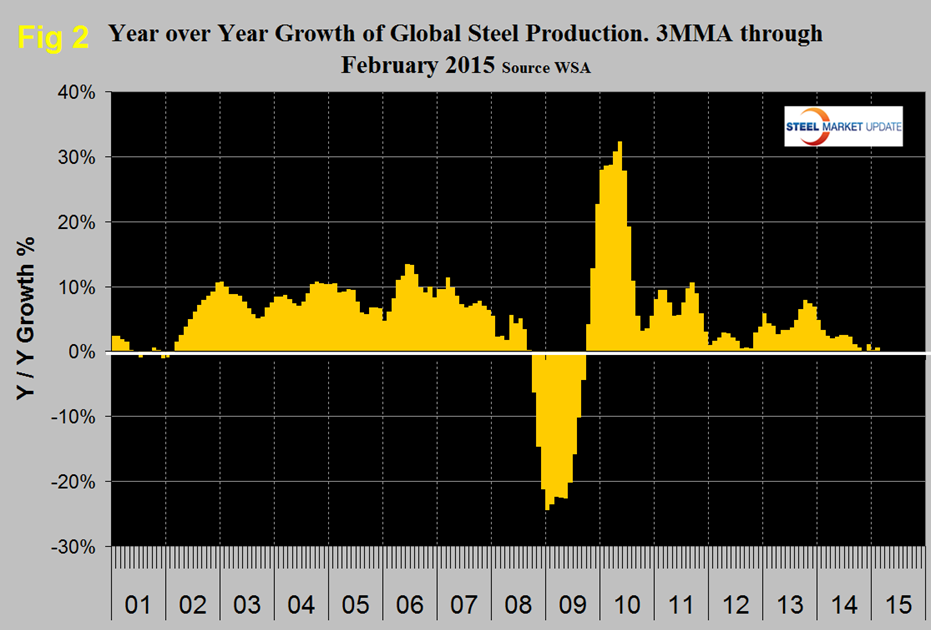
Growth in January was so low as not to make a blip on this chart. The recent decline in the price of oil, of iron ore and of the Baltic Index suggests that the global economy is weakening. Certainly there is a supply side to all three of those measures but it seems that demand is also down and suggests a further slowdown in global steel production in 2015. (Source: World Steel Association)


