

Analysis

April 16, 2015
Housing Starts and Permits through March and Builder Confidence in April
Written by Peter Wright
Starts in March rose by 14,000 to 926,000 after the revised decline of 164,000 in February. This data is seasonally adjusted by the Census department and the monthly numbers are annualized. The three month moving average, (3MMA) declined from 1,020,000 in February to 969,000 in March (Figure 1).
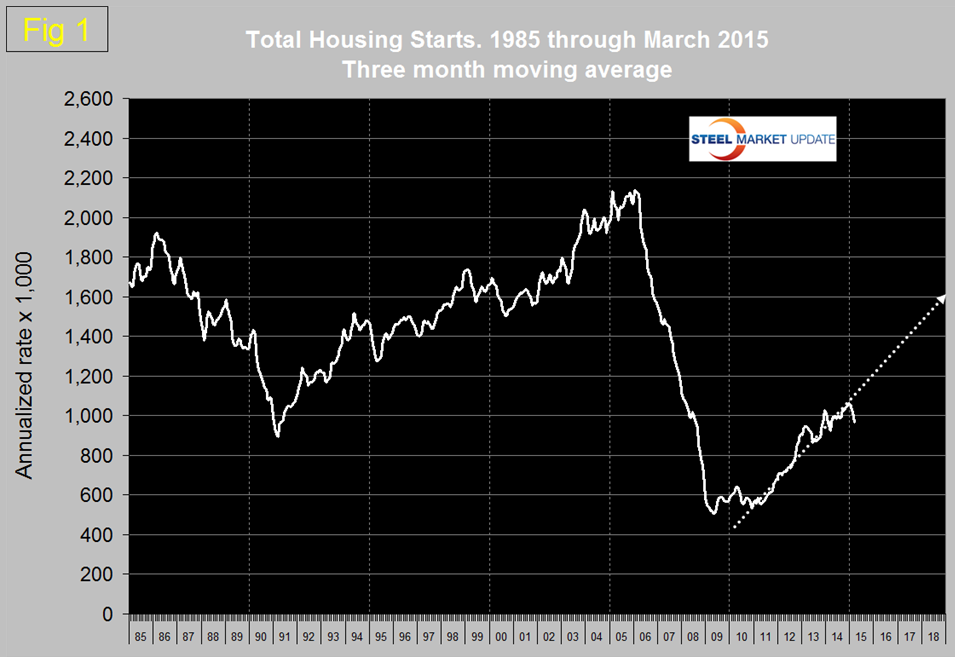
The projection to 1.6 million in 2018 is not looking so good at present. The 3MMA of March starts fell below a million after six consecutive months above that level. The year over year growth rate of the 3MMA of total starts in March was 4.7 percent. The growth rate by this measure is down from 16.7 percent in September. Note this is not seasonal because the data is seasonally adjusted and in addition we are considering year over year relationships.
Multifamily starts are now beyond the pre-recession high of February 2006 but the growth of starts in this sector has slowed dramatically from a 3MMA year over year of 35.5 percent in August to 3.1 percent in March (Figure 2).
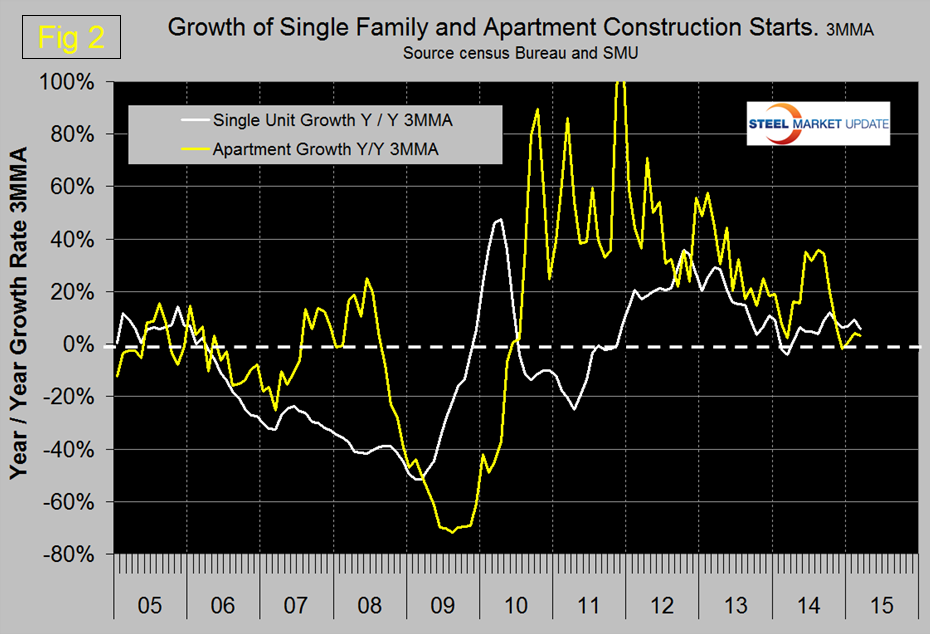
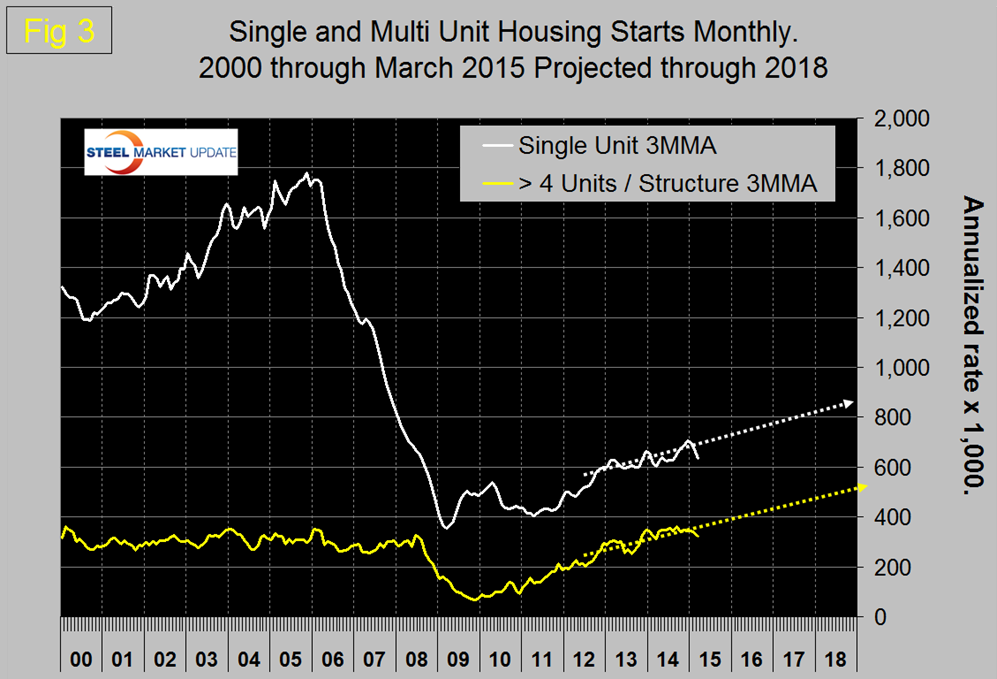
If we ignore the growth spurt of mid-2014, this sector has been slowing since early 2012 and may be approaching saturation. Single family is still 66.1 percent below the pre-recession level but growth in this sector has been higher than multi-family for the last five months. Figure 3 shows the trajectory of single family and apartments.
Permit data is useful is useful as a forward look at starts. If permits exceed starts, then we anticipate an acceleration in construction starts and vice versa. Table 1 shows total permits and starts nationally and regionally.
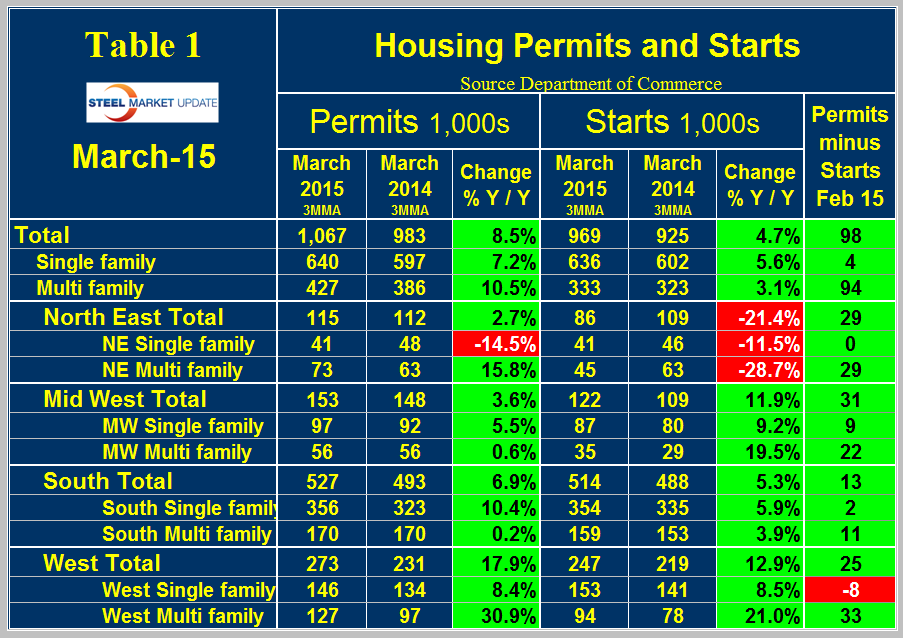
At the national level the differential between permits and starts for single and multi-family units is suggesting that the shift in consumer’s preference towards apartments is far from over. In March on a 3MMA basis permits of multi-family exceeded starts by 94,000 in contrast to the 4,000 for single family. In total permits were 98,000 more than starts. The differential between permits and starts for multi and single family units was the same across all regions. The permit data suggests that the recent decline in multifamily starts could be short lived and that the improvement in single family doesn’t have legs. The ratio of the two sectors is shown in Figure 4 and demonstrates that single family compared to multifamily has improved slightly but single family homes continue to be less desirable than at any time in the last 30 years.
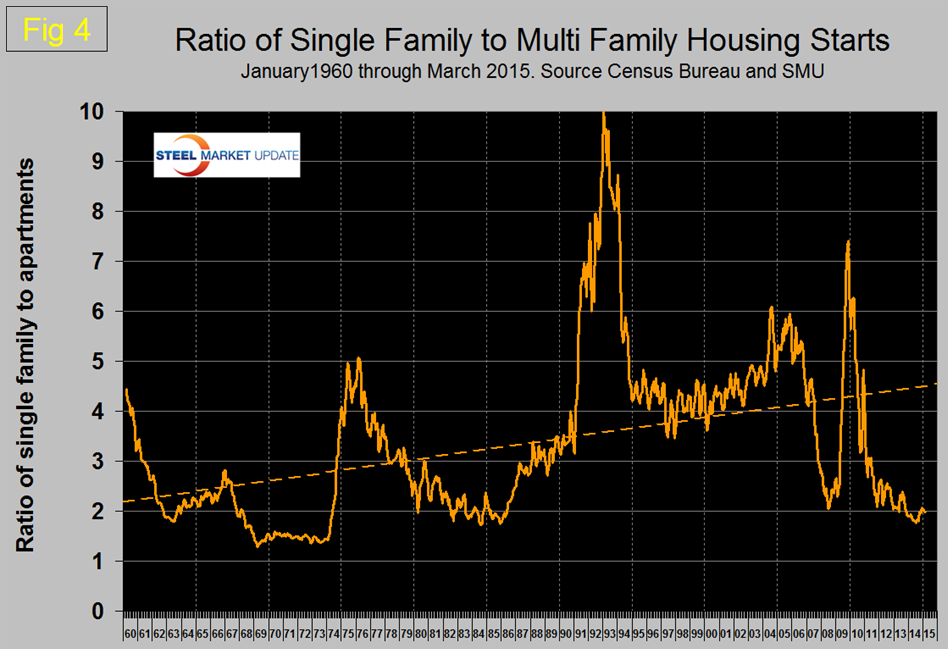
Based on permit data, the ratio will not change any time soon. We have made the following statements before but believe they bear repeating because those subscribers’ whose businesses rely on housing need to be aware that we may be experiencing a generational shift in home preference. Student loan debt exceeded $1.3 trillion for the first time in the third quarter of 2014, this must be impacting the young person’s view of other debt obligations and so, presumably, is the view that housing is not necessarily the great investment that it was once thought to be. In addition, uncertainty in the job market makes mobility desirable and promotes the idea of rent in preference to purchase.
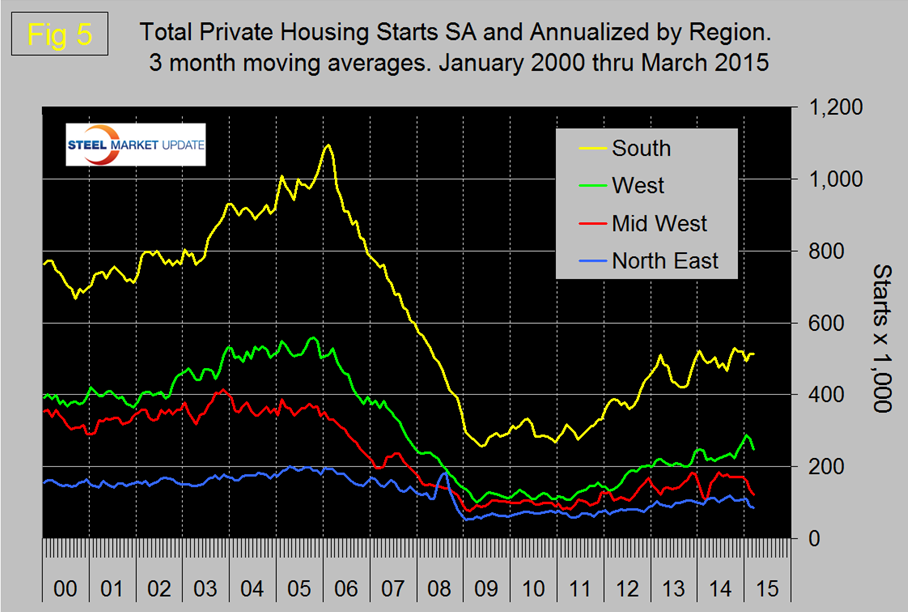
Figure 5 shows the regional situation for total residential starts since February 2000. So far in 2015 only the South has held its own.
The National Association of Home Builders (NAHB) confidence report was released on Wednesday. Any value above 50 indicates an overall positive business confidence. The index rose by four points to 56 in April.
The official release from the NAHB read as follows:
Builders’ Sentiment Bounces Back
Home builders reversed their one month decline in sentiment as the April NAHB/Wells Fargo Housing Market Index increased 4 points to 56 from a one-point downwardly revised 52 in March. The bounce back up to the January-February average suggests the March observation was an outliner.
All three components revived to or above the early part of 2015. Current sales index rose 3 points to 61 matching the February level and 1 point below the January report. The expected sales component rose 5 points to 64, the highest in 2015, and the traffic component rose 4 points to 41. The solid and significant increase in expectations suggests builders are expecting the market to continue growing.
Regionally, the outcome is more mixed, with the Northeast holding steady at 42 for the three-month moving average, the South rising one point to 56, the Midwest falling three points to 54 (but the only region that saw an increase from February to March) and the West dropping 3 points to 58.
Builders continue to be concerned about lot availability and, to a lesser extent, labor availability. The rising cost of these scarce resources along with rising cost of materials continues to squeeze builders’ profits.
Builders report consumers remain convinced that they have bargaining power on price and some sales fail because their offers or price maximums are below the cost of construction. Even with rising existing home values, construction costs including rising land and labor costs are making it more difficult to meet buyers’ expectations and compete with the alternative.


